Toolbox
- This section describes the functions within the Toolbox window.
- You can open or close it by pressing the hotkeys ‘Ctrl + T‘ or from the menu click ‘View’-> ‘Toolbox’.
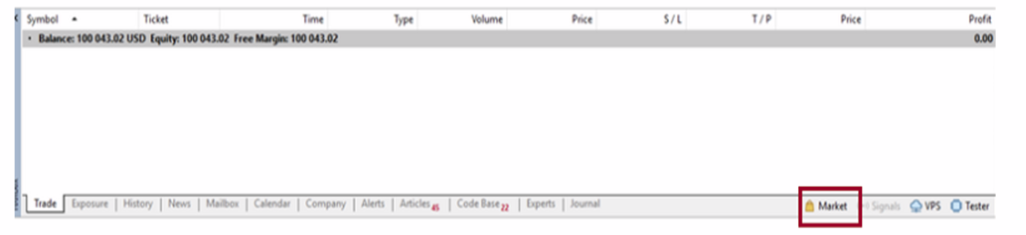
- 1. Trade: Here you can manage your open trades and pending orders.
- 2. Assets: This tab provides an overview of the financial instruments available for trading.
- 3. History: This section allows you to view your past trading activities.
- 4. News: Stay updated with the latest market news and events in this section.
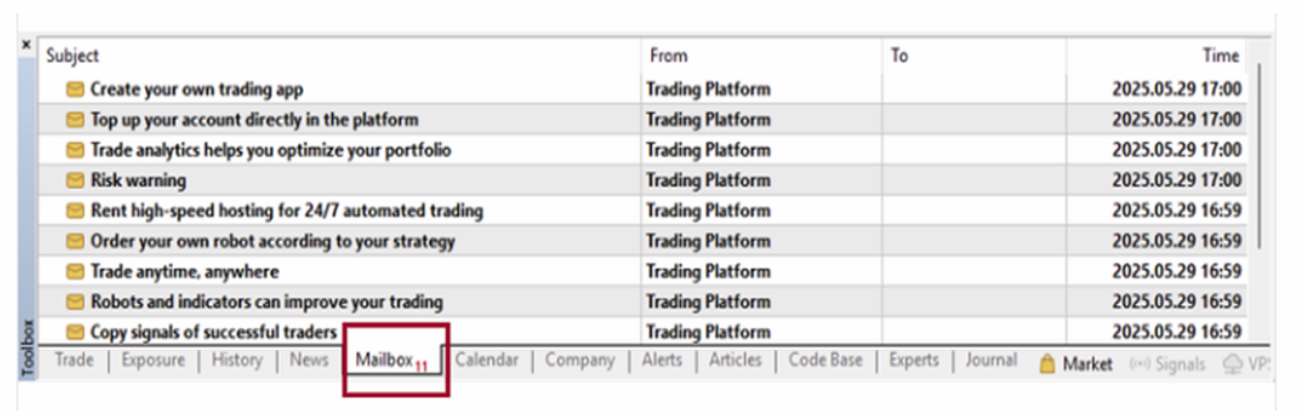
- 5. Mailbox: Access your MetaTrader5 mailbox from this tab.
- 6. Calendar: Keep track of important financial events and news releases with this built-in economic calendar.
- 7. Company: Information and details about the trading platform’s company can be found here.
- 8. Alerts: Set and manage alerts for specific market conditions from this tab.
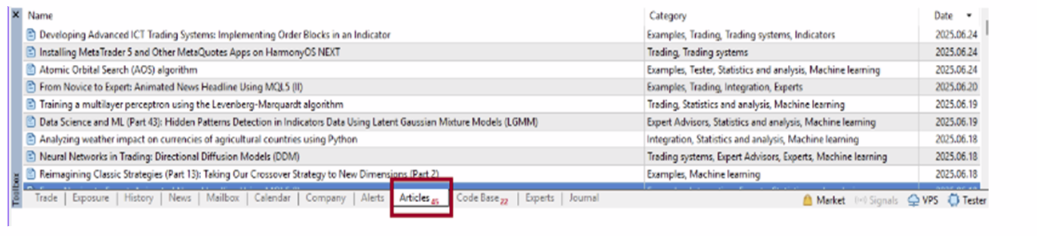
- 9. Articles: Here you can find informative articles about trading strategies, market analysis, and more.
- 10. Market: This section contains a library of scripts, indicators, and Expert Advisors.
- 11. Experts: You can access reports from Expert Advisors in this tab.
- 12. Code Base: A collection of reusable program code that contains common functions which can be called from Expert Advisors and Indicators.
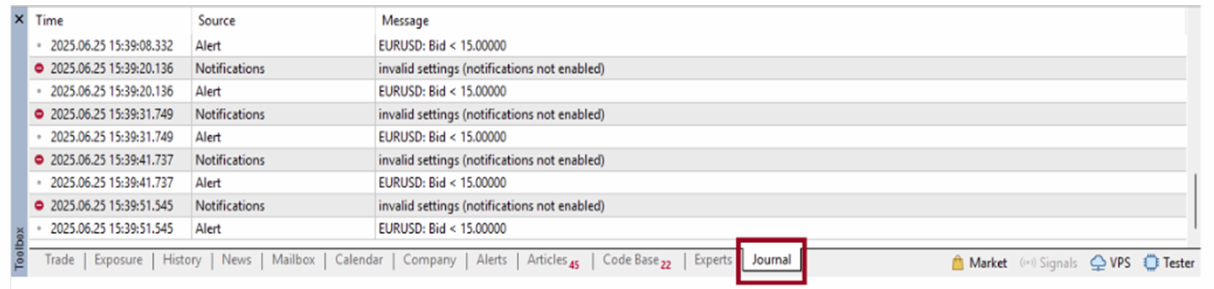
- 13. Journal: Displays a log of all actions and system messages performed on the MT5 platform, useful for troubleshooting and verifying operations.
- 14. Signals: A tab to manage the service that allows automatic copying of professional traders’ operations. You can subscribe to signals or register as a signal provider here.
- 15. Help Topics: A section containing help information such as instructions, feature explanations, and FAQs about the platform.
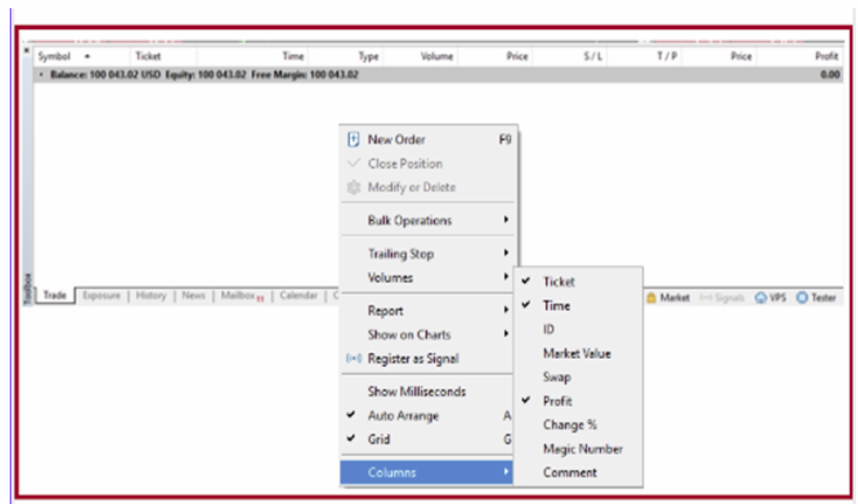
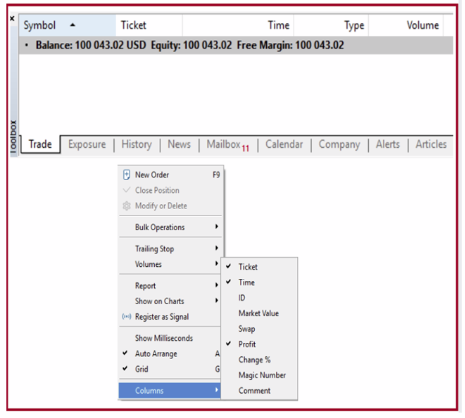
1. Trade
- 1. New Order: Place a new order. When an active position is selected, you can also choose to Close / Modify or Delete the order.
- 2. Trailing Stop: Allows you to place a trailing stop order on a position. This option is active only when a current position/order is selected.
- 3. Volume: Select whether you want to view the trade sizes in lots or the total amount.
- 4. Report: Export the trade history to a local file.
- 5. Show on Charts: Display other selected symbol deals.
- 6. Register as Signal: Submit your trade to the MQL5 community.
- 7. Show Milliseconds: Show/hide milliseconds of open/ close time of trades.
- 8. AutoArrange: Automatically adjusts the size of each column in the window for an optimised view.
- 9. Grid: Show/hide borders around the trades.
- 10. Columns (Commission/Swap): show/hide Commission/Swap and Comment columns of trades.
2. Assets

The information is displayed in a tabular format containing the following variables:
1. Assets: This is the name of a currency pair or other financial instrument that you’re trading.
2. Volume: This represents the size or quantity of open positions for each asset.
3. Rate: This refers to the exchange rate of the asset relative to the base currency of your account.
4. Base Currency: This shows the amount of funds that are reserved or “blocked” in your account to maintain the open positions.
5. Chart: This is a graphical representation of the volume of long (buy) and short (sell) positions for each asset.
3. History
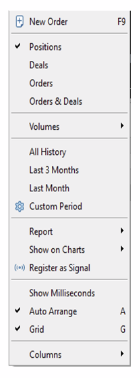
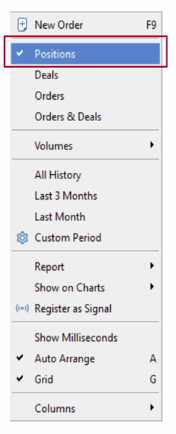
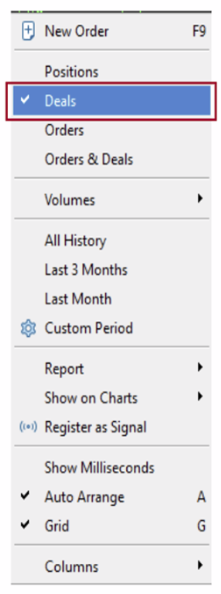
If you right-click anywhere in the history window, you will be presented with additional options for viewing, including:
1. Positions/Deals/Orders: Displays your trades in different ways.
2. Symbols: Choose which Symbols you want to display.
3. Volumes: Choose whether to display trade sizes in lots or total amount.
4. All History/Last 3 Months/Last Month/Customer Period: choose date range of trades.
5. Report: export trade history to local file.
6. Show Milliseconds: show/hide milliseconds of open/ close time of trades.
7. Auto Arrange: The display items will be arranged automatically based on MT5’s display size.
8. Grid: shows/hides the frame around the trades.
9. Columns: choose whether to display information such as ‘Commission’, ‘Profit Change’, ‘Swap’, and other details.
Four types of trade history in MT5
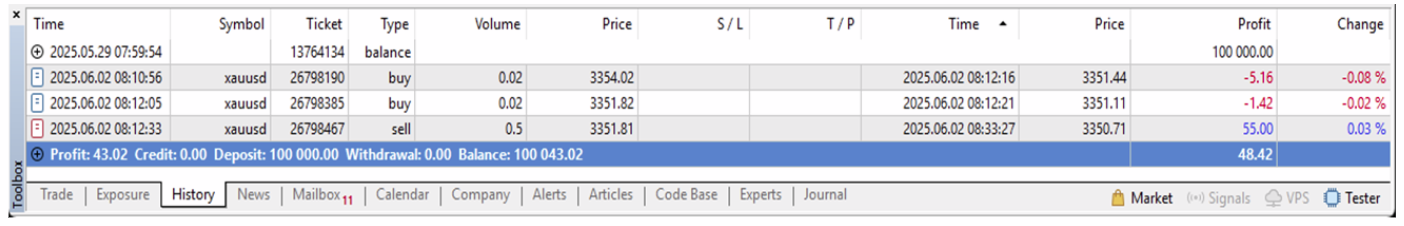
3.1. Positions View in MT5
The displayed columns, from left to right, are as follows:
1. Time: Entry time of the position.
2. Symbol: Displays the trading instrument.
3. Ticket: Displays the order number.
4. Type: Displays the type, such as ‘Balance’ (deposit/withdrawal), ‘Buy’ or ‘Sell’.
5. Volume: Displays the trade volume (in lots).
6. Price: Displays the entry price.
7. S/L: Displays the Stop-Loss price, if set.
8. T/P: Displays the Take-Profit price, if set.
9. Time: Displays the closing time.
10. Price: Displays the closing price.
11. Profit: Displays the Profit/Loss.
12. Change: Displays the percentage change in price. For a Buy position, it shows ‘(closing price – entry price) / entry price’; and for a Sell position, it shows ‘(entry price – closing price) / entry price’.
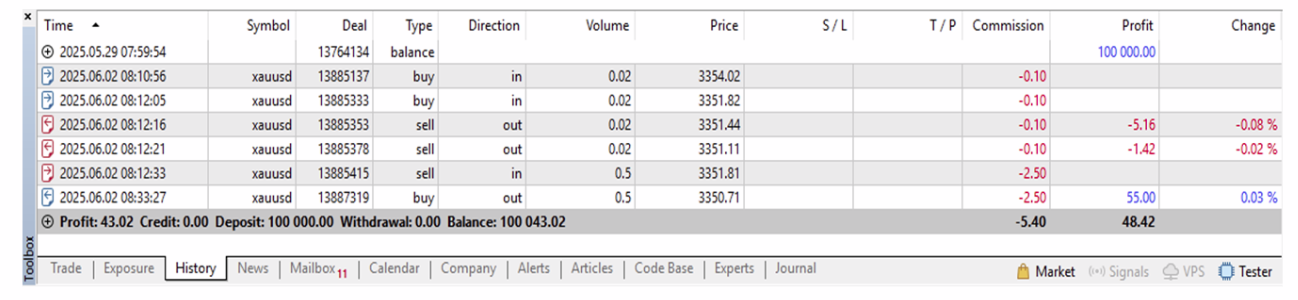
3.2. Deals View in MT5
The displayed columns, from left to right, are as follows:
1. Time: Displays the trade execution time.
2. Symbol: Displays the trading instrument.
3. Deal: Displays the deal number.
4. Type: Displays the type, such as ‘Balance’ (deposit/withdrawal), ‘Buy’ or ‘Sell’.
5. Action: Displays the action, indicating whether it is an entry (‘in’) or a closing (‘out’) trade.
6. Volume: Displays the trade volume (in lots).
7. Price: Displays the entry price.
8. S/L: Displays the Stop-Loss price, if set.
9. T/P: Displays the Take-Profit price, if set.
10. Commission: Displays the generated commission.
11. Profit: Displays the Profit/Loss.
12. Change: Displays the percentage change in price. For a Buy trade, it shows ‘(closing price – entry price) / entry price’; and for a Sell trade, it shows ‘(entry price – closing price) / entry price’.
3.3. Orders View in MT5
1. Time: Displays the trade placement time.
2. Symbol: Displays the trading instrument.
3. Ticket: Displays the order number.
4. Type: Displays the order type, such as Buy, Sell, Buy Limit, Buy Stop, Sell Limit, or Sell Stop.
5. Volume: Displays the trade volume (in lots).
6. Price: Displays the entry price.
7. S/L: Displays the Stop-Loss price, if set.
8. T/P: Displays the Take-Profit price, if set.
9. Time: Displays the closing time.
10. Status: When an order is filled, it is displayed as ‘Filled’, while a canceled order is displayed as ‘Canceled’.
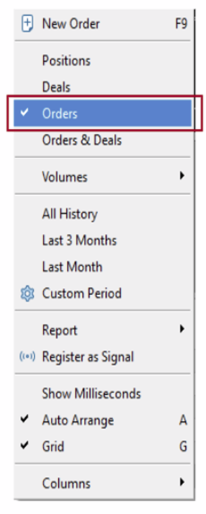
This is how the orders section looks in MT5

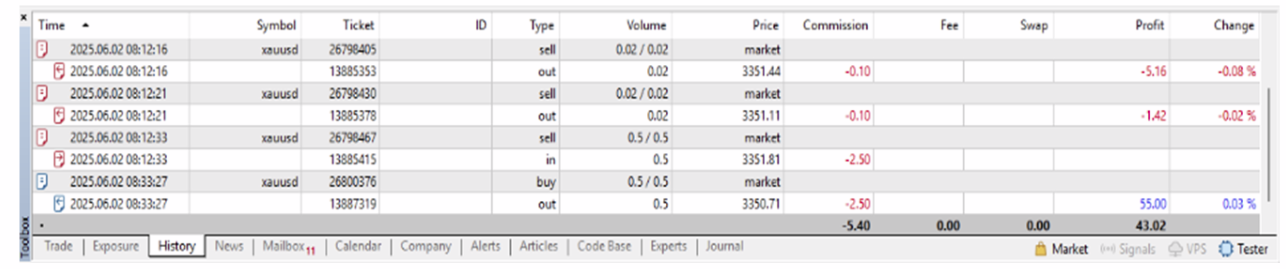
3.4. Orders & Deals View in MT5
1. Time: Displays the trade time.
2. Symbol: Displays the trading instrument.
3. Ticket: Displays the order number in the ‘Order’ row and the trade number in the ‘Trade’ row.
4. ID: Displays the trade ID.
5. Type: In the ‘Order’ row, it shows Buy, Sell, Buy Limit, Buy Stop, Sell Limit, or Sell Stop. In the ‘Trade’ row, it shows ‘in’ for entry trades and ‘out’ for closing trades.
6. Volume: In the ‘Order’ row, it shows order numbers/trade volume, and in the ‘Trade’ row, it shows trade volume.
7. Price: In the ‘Order’ row, it displays ‘Market’ for market orders. For Limit or Stop orders, it shows the specified price. The execution price is displayed in the ‘Trade’ row.
8. Commission, Feed and Swap: For OANDA these fields are empty.
9. Profit: In the ‘Order’ row, for take-profit (TP) or stop-loss (SL), it displays ‘TP price’ or ‘SL price’. In the case of a stop-out, it shows the percentage. When an order is canceled, it displays Cancelled. Additionally, in the ‘Trade’ row, it shows the Profit/Loss on closing.
10. Change: Displays the percentage change. For Buy trades, it shows ‘(closing price – entry price) / entry price’; and for Sell trades, it shows ‘(entry price – closing price) / entry price’.
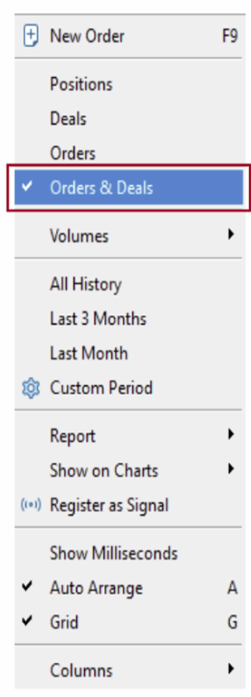
Here is an example of the Orders & Deals section.
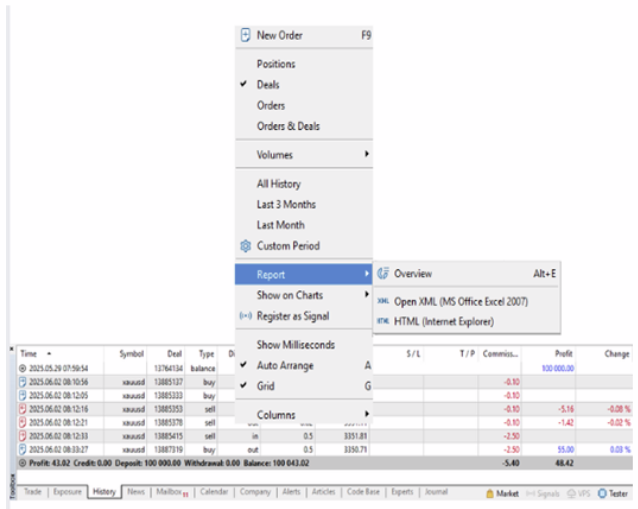
YOU CAN MAKE A REPORT ON YOUR TRADE HISTORY
Many traders need trade statements for personal analysis or tax purposes.
MT5 provides you with the ability to generate reports on your entire trading
history or on user-defined time periods.
To start this process, you need to display the Toolbox window(Note: In MT4,
this window used to be called the Terminal window).
Call the Toolbox window from the toolbar or press CTRL+T.
Alternatively, you can call it up from the View menu. This will display the
Toolbox window. Click on the History tab, which displays the current month’s
trade history.
Right-click anywhere in the window and select one of the 4 options:
- – All history
- – Last 3 months
- – Last month
- – Custom period (here you can select a specific to and from date).
This will display the corresponding trading history in the Toolbox window.
Right-click again in the Toolbox window and select under Report whether
you want to save your report as an XML file or as an HTML file. This will
create the appropriate file that you can save to your computer and open from
there.
4. News
5. Mailbox
6. Calendar

1. Export – Allows you to export the currently displayed events to a local HTML file.
2. Previous Week / Current Week / Next Week – Displays the events for the corresponding period.
3. Previous Month / Current Month / Next Month – Displays the events for the corresponding period.
4. Priority – Shows/hides all events and holidays, events with low priority, medium priority or high priority.
5. Currency – Shows/hides events by currency.
6. Country – shows/hides events by country.
7. Company
8. Alerts
– Right-click on the alert to either modify, delete, or enable/disable it. Click 「Create」 to create a new alarm. Please note that alarms on MT5 are stored locally on your computer, so if you want to receive them, you need to turn on your computer and run MT5.
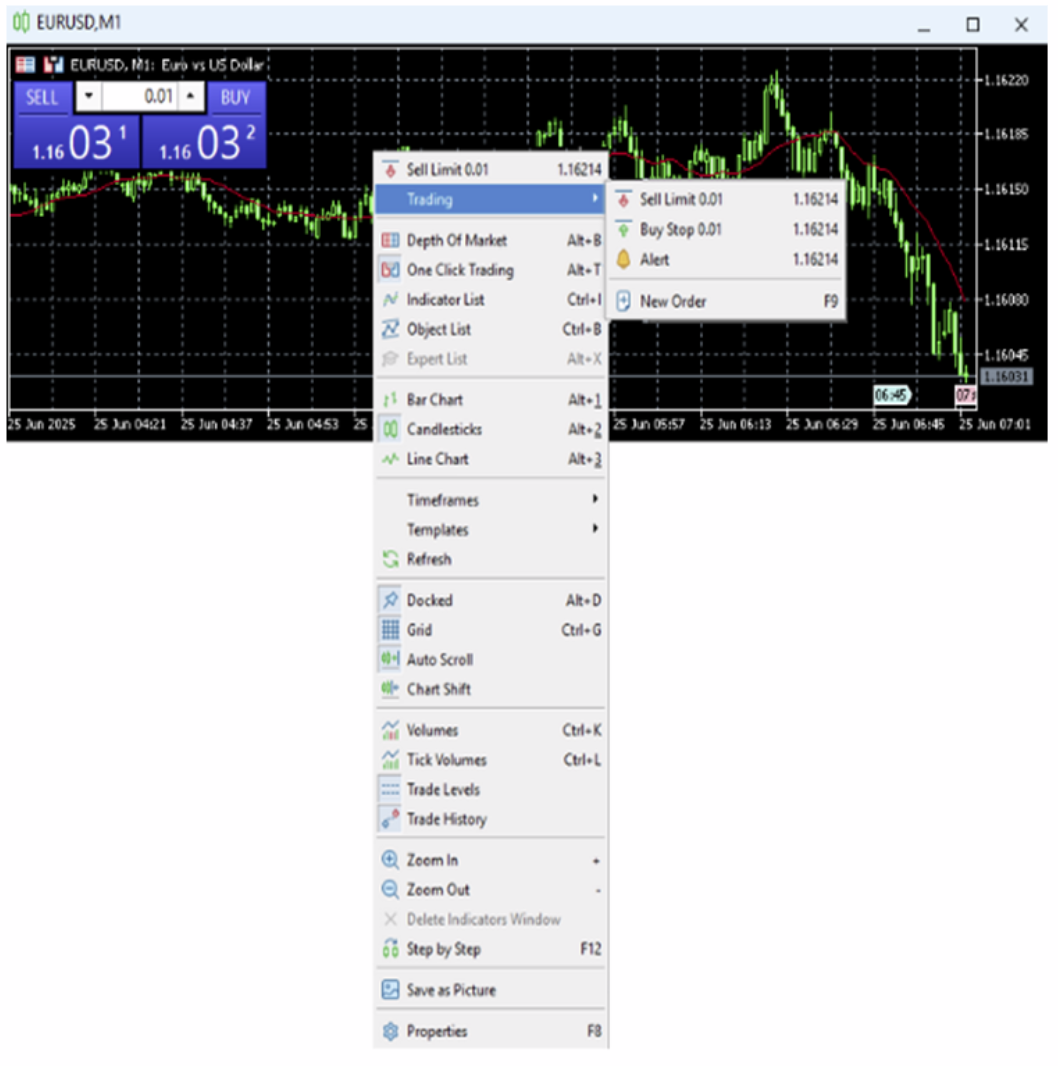
– To create a new alert on your chart, right-click on the chart at the price level you want to set the alert for. Then select Trade > Alert. This will trigger an alert at the price level you set, indicated by the red arrow on your chart.
– You can change the price level of the alert by clicking and dragging it to the desired location. Or by clicking the right mouse button on the Arrow and selecting Modify, Delete or Disable. If you choose Modify, you can change various settings in the Alarm Editor, as described below.

2. Action – select how the alarm should be issued – via a sound, print to a file, send to your e-mail (mail) or cell phone
PLEASE NOTE: you must set up your email or cell phone (at Tools> options) to accept this form of notification.
4. Source:
– If the 【Sound】 action is selected, you can select the sound that will be heard when the alert is triggered.
– If the 【File】 action is selected, you can select the output file to which the alert will be printed.
– If 【Mail】 is selected, you can change the email that will be sent.
– For the 【Notification】 action, there is no change.
5. Timeout – You can select the timeout between alarms. Similar to the snooze function of your alarm clock, here you can set whether the alarm should remind you again after it has been triggered for the first time.
6. Maximum Retries – The number of times the alarm should retry from the time it was first triggered.
7. Expiration – You can set the expiration date and time for your alarm.
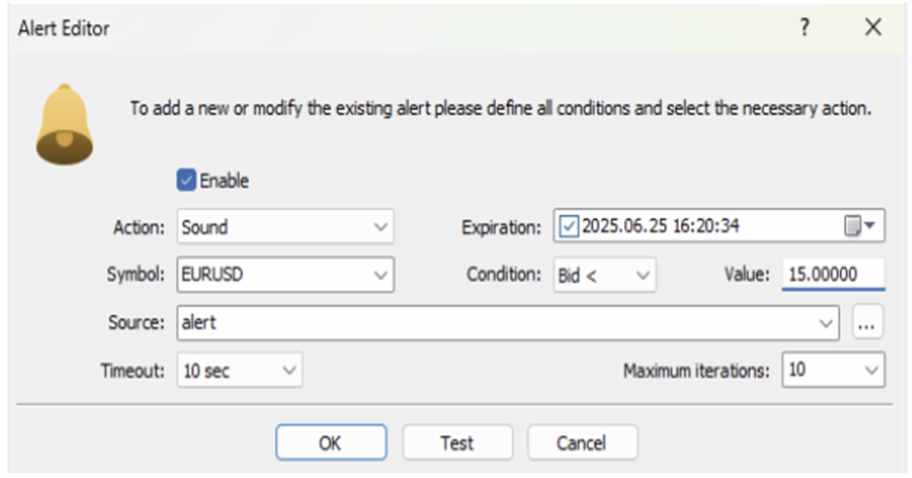
- 9. Condition: define what condition should apply in relation to the rate value you set (see below).
- – Bid> : Bid price is greater than price value set
- – Bid< : Bid price is less than price value set
- – Ask> : Ask price is greater than price value set
- – Ask< : Ask price is less than price value set
- – Last< : Last price is less than price value set
- – Last> : Last price is greater than price value set
- – Volume< : Volume is less than value set
- – Volume> : Volume is greater than value set
- – Time= : Server time is equal to Time value set
- 10. Value: Set the Value you want relative to the condition you set.
9. Articles
10. Market


Search for your product under the appropriate category. Once you find the product, double-click on it or drag it to your active chart to apply it.
Please note that indicators and Expert Advisors usually have settings that you can change. Select the desired setting and your product will be applied to the active chart.
11. Experts

12. Code

There are several options when you right-click on a product.
1. View – Brings up the website and shows you more details about the product, including how it works, performance tests, and details about the settings.
2. Download – This allows you to download the product directly to your MT5 platform. After downloading, simply access your Navigator window (CTRL-N or View menu > Navigator) and locate the product you downloaded in your list. You can then either double click on the product or drag it onto your chart to use it.
3. Order your own program – takes you to the MQL5 Freelance service where you can have your own ideas programmed into an Expert Advisor, Indicator or Script.
4. Expert Advisors/Indicators / Scripts – filter which categories you see in the list
13. Journal
If you have problems with MT5, you can view the log on the Journal tab and fix the problem.
14. Signals
Working with the signals service has a lot of advantages:
- ➡There is no need to conclude a contract between a provider and an investor.
- ➡Copying of trades is fully automated. Your participation is not required.
- ➡A signal provider and a subscriber can have accounts with different brokerage companies.
- ➡Ultra-fast data exchange protocols significantly reduce delays in executing orders on a subscriber’s account.
- ➡Data transfer is absolutely secure.
- ➡Fixed subscription price, no additional commissions for a subscription.
*Please note: You can subscribe demo account as well as real accounts to signal services.
To subscribe to a Signal service:
1. Select the signal service provider you are interested in.
2. Then click the Subscribe for free button.
3. Once you have chosen your options to subscribe and agreed to the terms and conditions, your trading account will now accept automated trading signals from that provider.
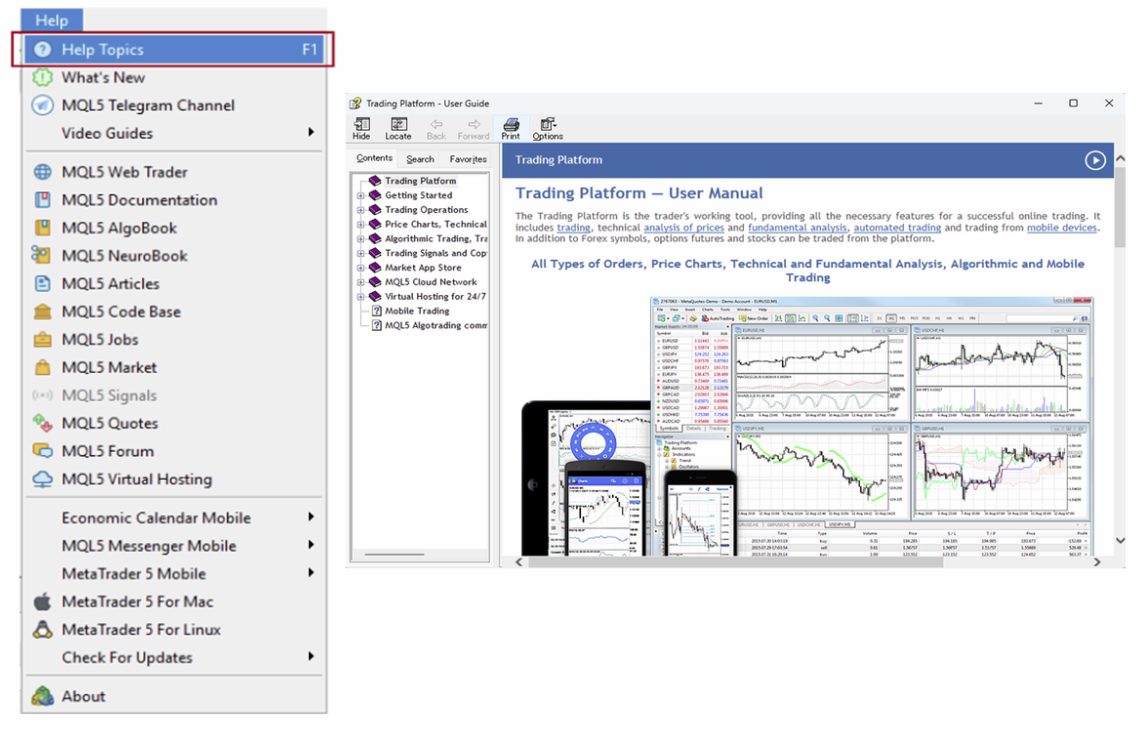
15. Help Topics
Alternatively, you can also visit the online guide from MetaTrader5 here at https://www.metatrader5.com/en/ terminal/help