How to draw on charts using objects
Find the Object Toolbar located in the top-left corner of the platform screen.
This toolbar contains various drawing tools such as trend lines, horizontal lines, vertical lines, Fibonacci tools, and text.

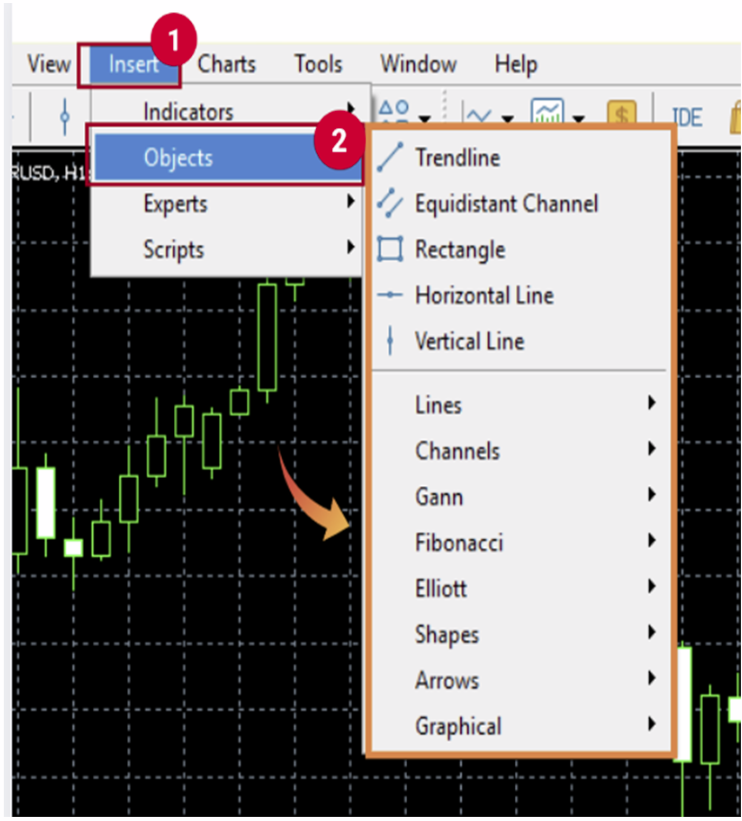
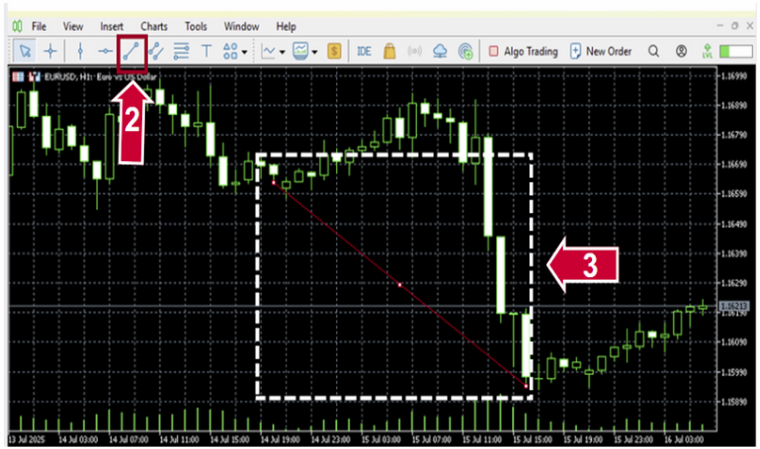
Click on the tool you want to use (e.g., trendline) from the Object Toolbar.
Step 3: Draw on the Chart
Using the selected object, click and drag on any area of the chart to draw it.
Right-click on a drawn object and select “Properties” to customize its color, line thickness, and style.
You can also click to select the object, then drag to move it or press the Delete key to remove it.

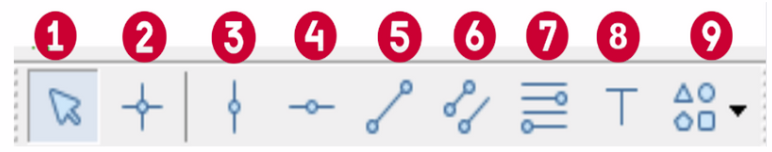
② Crosshair : to highlight coordinates of the selected point in the chart or indicator window. This mode can only work within the active chart window. Click and drag on an active chart whilst in Crosshair mode, to draw a line connecting two points. The distance between the points and the current price value will be highlighted to the right of the second point of the line.
③ Draw a vertical line : to draw a vertical line on your chart.
④ Draw a horizontal line : to draw a horizontal line on your chart.
⑤ Draw trendline : to draw a freehand trendline anywhere on your chart.
⑥ Draw equidistant channel : to draw an equidistant channel.
⑦ Draw Fibonacci retracement : to draw a Fibonacci retracement.
⑧ Draw text label : to add a text label. After this button has been pressed, one should select a point in the chart where the label should be placed. Unlike the Draw text object, the Draw text label is attached to the chart window. When the chart is scrolled, the text label does not move.
⑨ Arrows : to manage, add or delete graphical symbols.