The MT5 toolbar has three segments to it
1. Standard Tools
2. Line Studies
3. Time Frames
1. Standard Tools
2. Line Studies
3. Time Frames
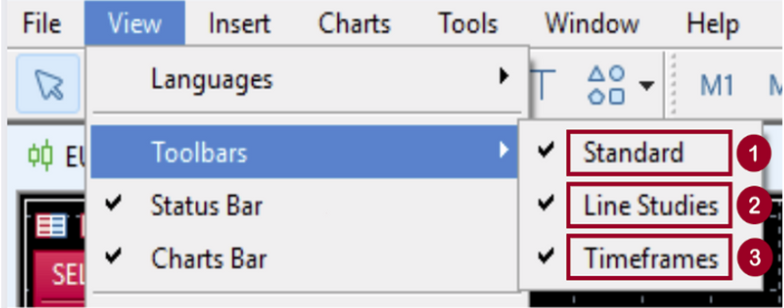
Right-click on the toolbar area, then click on any of the options: “Standard,” “Line Studies,” or “Timeframes” to toggle their visibility.
A check mark (✔) indicates that the toolbar is currently displayed.
If there is no check mark, the toolbar is hidden.
A check mark (✔) indicates that the toolbar is currently displayed.
If there is no check mark, the toolbar is hidden.
1
Standard

 |
Opens a new currency pair window. You can select the required currency pair from the list and open a new chart. |
|---|---|
 |
This menu allows you to manage and operate chart groups. Profiles can be activated or deleted and are saved based on the current chart window configuration. |
 |
Displays the list of symbols. You can change the visibility of each currency pair. |
 |
Opens the MetaQuotes Language Editor. You can create and edit Expert Advisors, Custom Indicators, and Scripts. |
 |
Displays the MQL5 Market, where you can purchase EAs. |
 |
Displays the MQL5 Market, where you can purchase paid signals. |
 |
Opens MQL5’s dedicated VPS settings for MetaTrader. |
 |
Allows you to register a trading signal source account. |
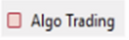 |
Enables or disables automated trading, such as Expert Advisors (EAs). A red square indicates “stopped,” while a green triangle indicates “auto trading active. |
 |
Displays a window for placing market orders or pending orders. |
 |
Displays the chart as a series of bars. |
 |
Displays the chart as a series of candlesticks. |
 |
Displays the chart as a series of lines. |
 |
Zooms into the chart. |
 |
Zooms out of the chart. |
 |
Arranges the chart windows. |
 |
Automatically scrolls the chart to the latest bar. |
 |
Moves the position of the latest bar on the chart to the position of the chart shift label. |
 |
Saves the chart as an image. |
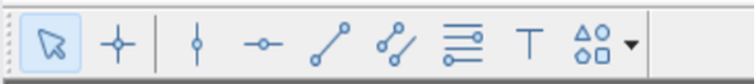
2
Line Studies
 |
Allows you to select various objects on the chart with the cursor. |
|---|---|
 |
Highlights the coordinates of the selected position on the chart or analysis tool screen. |
 |
Inserts a vertical line on the chart. |
 |
Inserts a horizontal line on the chart. Inserts a trendline on the chart. |
 |
Creates a parallel channel. |
 |
Inserts a Fibonacci retracement on the chart. |
 |
Allows text labels to be attached to the chart screen, not directly on the chart. |
 |
Allows you to place arrows, thumbs up, and other shapes. |
3
Time Frames
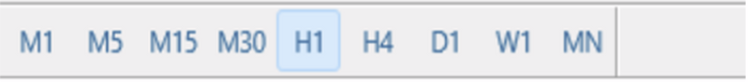
Click the chart you want to change the display for, then click the timeframe on the toolbar.
- M1: 1-minute chart
- M5: 5-minute chart
- M15: 15-minute chart
- M30: 30-minute chart
- H1: 1-hour chart
- H4: 4-hour chart
- D1: daily chart
- W1: weekly chart
- MN: monthly chart