List of MT5 Shortcut Keys
By combining special keys and alphabet keys on your keyboard, you can perform various operations quickly and efficiently.
Make good use of shortcut keys for frequently used actions to improve your workflow.
List of Shortcut Keys
| Shortcut Keys | Operation |
|---|---|
| Scroll the selected chart to the right (toward the most recent data). | |
| Scroll the selected chart to the left (toward historical data). | |
| + | Zoom in on the selected chart. |
| – | Zoom out of the selected chart. |
| Page Up | Quickly scroll the selected chart to the left (toward historical data). |
| Page Down | Quickly scroll the selected chart to the right (toward the most recent data). |
| Home | Move to the far left of the selected chart (oldest data). |
| End | Move to the far right of the selected chart (newest data). |
| Backspace | Delete the most recently drawn object. |
| Delete | Delete the currently selected object. |
| Tab | Switch tabs in the Market Watch window (if displayed). |
| Enter | Show or hide the First Navigation Box on the selected chart. |
| F1 | Display the MT5 Help Topics window. |
| F2 | Show or hide the Task Manager window. |
| F3 | Display the Global Variables window. |
| F4 | Launch the MetaEditor. |
| F6 | Launch the Strategy Tester Agent Manager. |
| F7 | Display the Expert Advisor (EA) settings window when using one. |
| F8 | Display the Properties window for the selected chart. |
| F9 | Open the Order window for the selected chart. |
| F10 | Show or hide the Popup Prices window. |
| F11 | Toggle full-screen mode for the selected chart. |
| F12 | Move the selected chart forward by one candlestick. |
| Ctrl+F1 | Display the search bar on the far right of the toolbar. |
| Ctrl+F4 | Close the selected chart. |
| Ctrl+F5 | Switch to the next chart profile (layout). |
| Ctrl+F6 | Switch between multiple open charts. |
| Ctrl+A | Reset the height of the subwindow to default when indicators are shown there. |
| Ctrl+B | Open the Object List window when objects are displayed. |
| Ctrl+D | Show or hide the Data Window. |
| Ctrl+E | Toggle the AutoTrading icon on the toolbar. When on, Expert Advisors (EA) are enabled; when off, they are disabled. |
| Ctrl+F | Switch the mouse cursor to crosshair mode on the selected chart. |
| Ctrl+G | Show or hide the grid on the selected chart. |
| Ctrl+H | Show or hide OHLC (Open, High, Low, Close) values at the top of the selected chart. |
| Ctrl+I | Open the Indicator List window when indicators are displayed. |
| Ctrl+K | Show or hide volume display on the status bar. |
| Ctrl+L | Show or hide tick volume at the bottom of the selected chart. |
| Ctrl+M | Show or hide the Market Watch window. |
| Ctrl+N | Show or hide the Navigator window. |
| Ctrl+O | Open the Options window. |
| Ctrl+P | Open the Print window. |
| Ctrl+R | Show or hide the Strategy Tester window. |
| Ctrl+S | Open the Save window for the selected chart. The data that can be saved includes: date, time, open, high, low, close, and volume. |
| Ctrl+T | Show or hide the Toolbox window. |
| Ctrl+U | Show or hide the Symbols window. |
| Ctrl+W | Close the selected chart. |
| Ctrl+Y | Show or hide period separators on the selected chart. |
| Ctrl+Z | Undo the last deleted object on the selected chart. |
| Ctrl+Tab | Switch between open charts when multiple charts are displayed. |
| Alt+F4 | Exit MT5. |
| Alt+1 (numpad not allowed) | Change the selected chart type to Bar Chart. |
| Alt+2 (numpad not allowed) | Change the selected chart type to Candlestick Chart. |
| Alt+3 (numpad not allowed) | Change the selected chart type to Line Chart. |
| Alt+B | Show or hide the Depth of Market window. |
| Alt+D | Toggle the Docking function on the selected chart. |
| Alt+E | Display the Reports window. |
| Alt+M | Show or hide the MQL5 Community login window. |
| Alt+R | Tile all chart windows. |
| Alt+T | Show or hide the One Click Trading panel on the selected chart. |
| Alt+W | Display the Window management screen. |
| Alt+Backspace | Undo the last deleted object on the selected chart. |
| Shift+F5 | Switch to the previous chart profile (layout). |
| Shift+F12 | Move the selected chart backward by one candlestick. |
| Ctrl+Shift+D | Open the Data Folder. |
Customize Toolbar Buttons in MT5


The “Available buttons” on your left side shows buttons not displayed on the toolbar.
The “Selected buttons” on your right shows buttons that are currently being displayed on the toolbar.
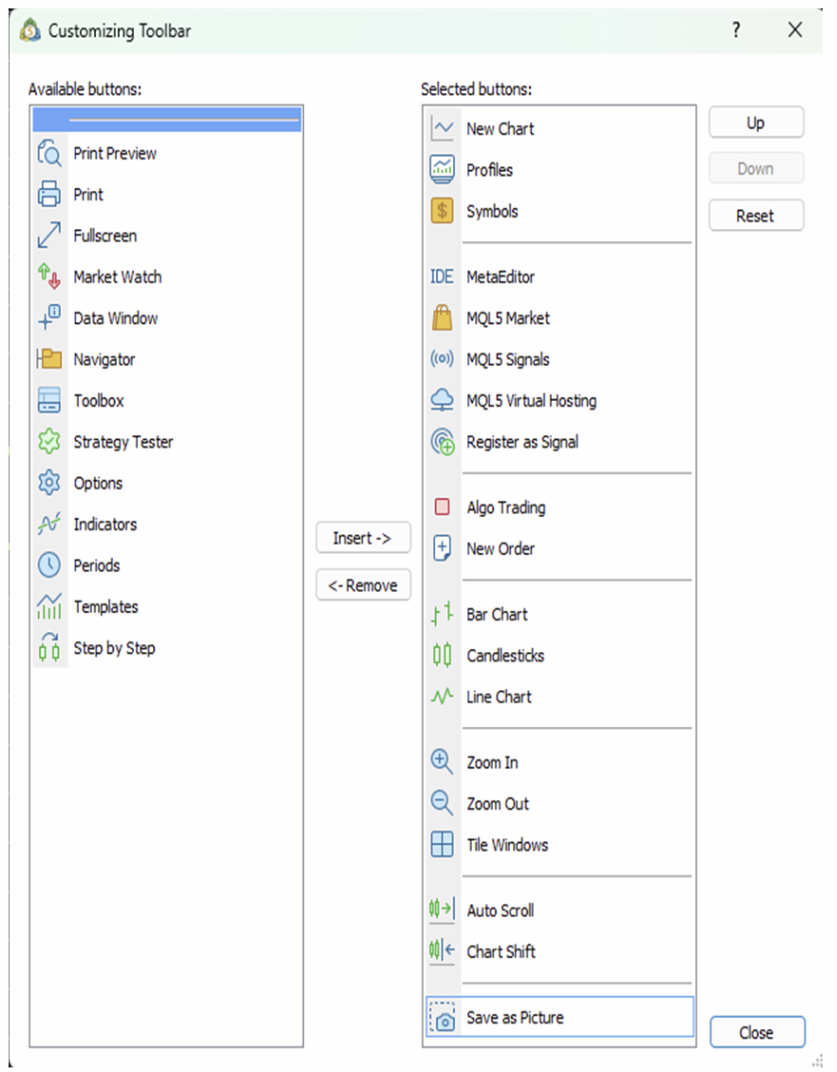
Select a button you wish to add to the toolbar in the “Available buttons” and click “Insert ->”.
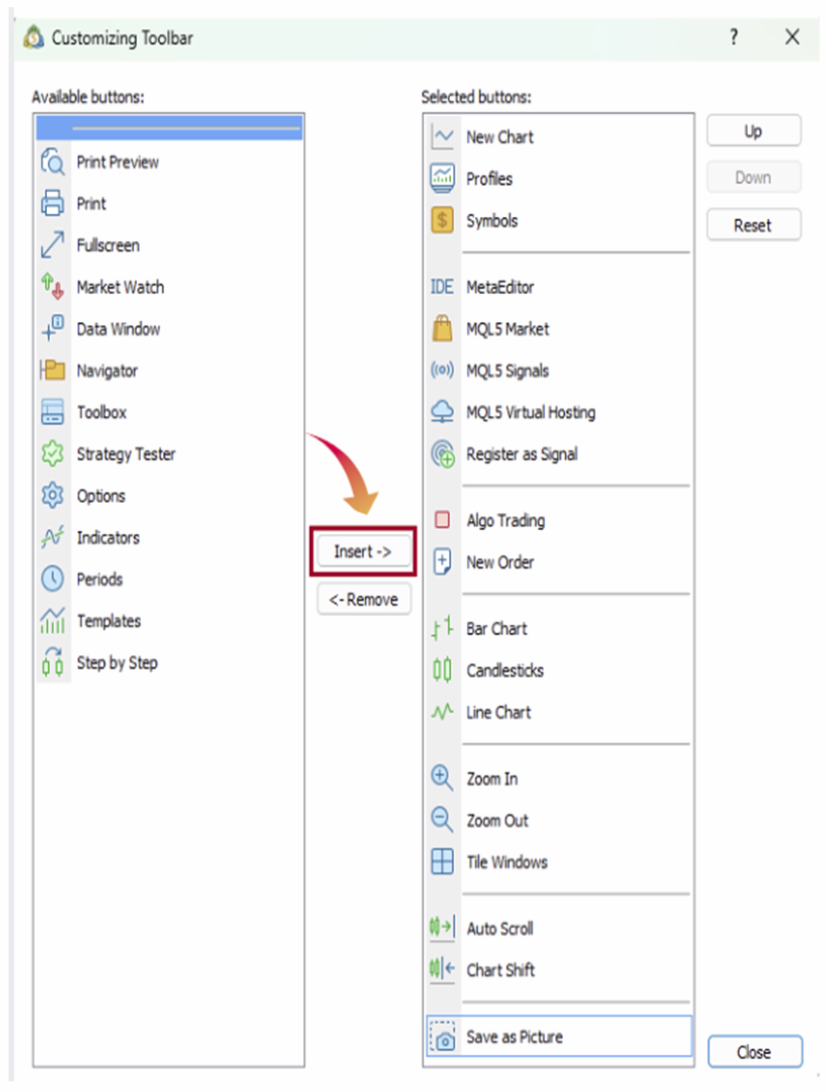
Select a button you wish to remove from the toolbar in the “Selected buttons” and click “<- Remove ".

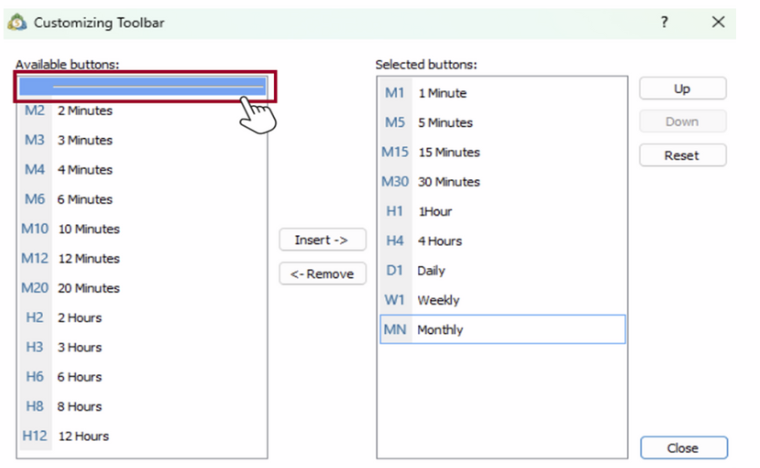
To add a separating line, select the line in the “Available buttons” and click “Insert ->”.
To remove a line, select the line in the “Selected buttons” and click “<- Remove;".
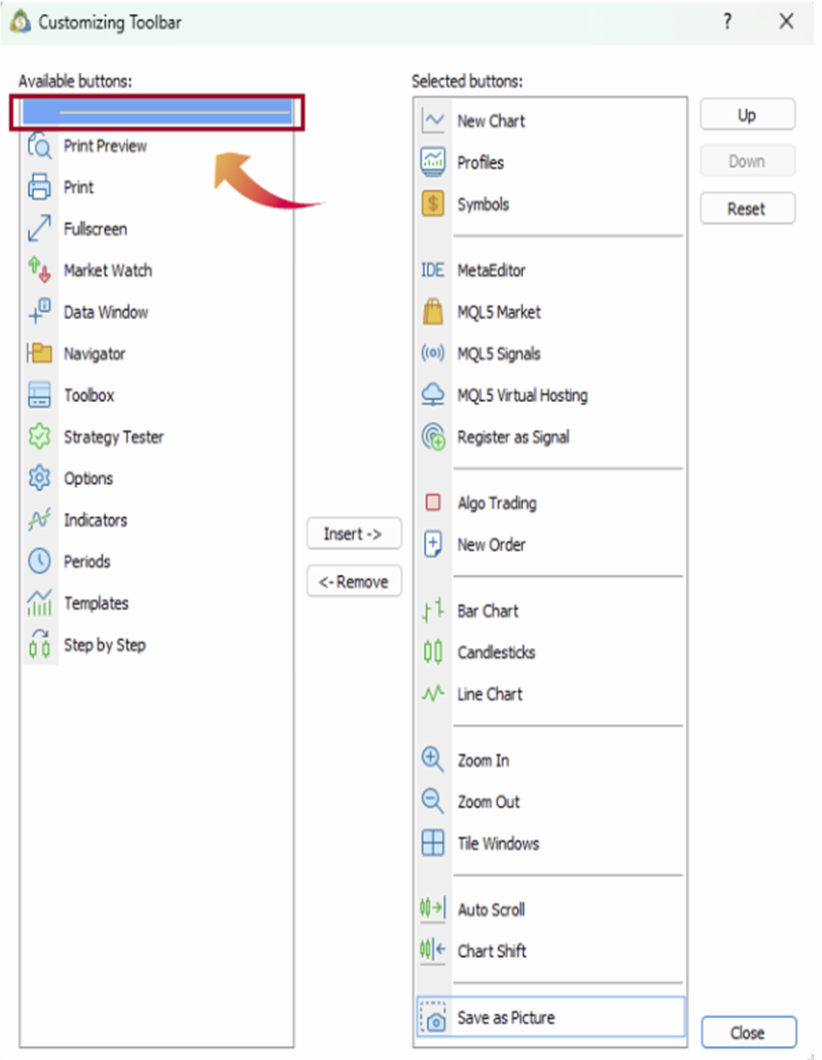
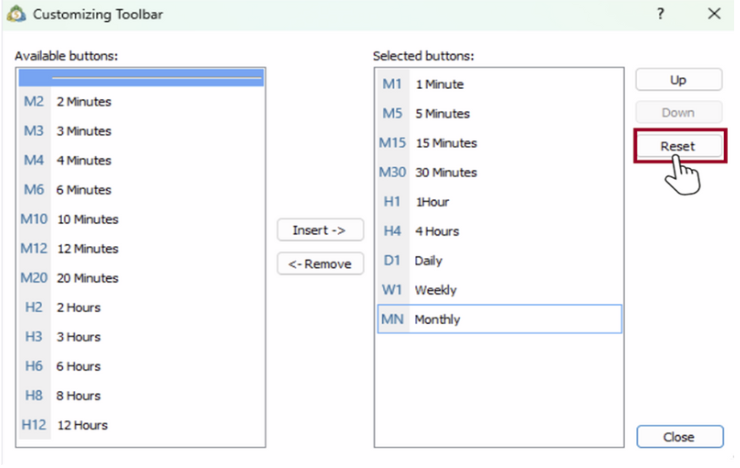
Click “Reset”

Select a button wish to move in the “Selected buttons” and click “Up” or “Down” to change the location.

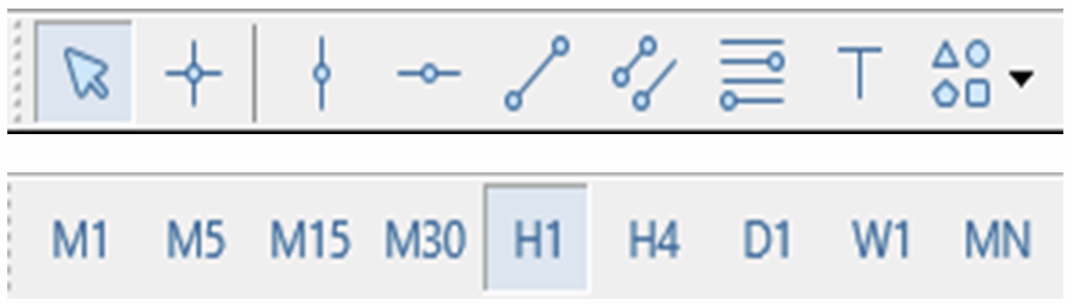
Customize Timeframes Toolbar in MT5
Available Timeframes
MT5 offers a total of 21 different timeframes, which are as follows:
-
Minutes:
M1 (1 Minute), M2 (2 Minutes), M3 (3 Minutes), M4 (4 Minutes),
M5 (5 Minutes), M6 (6 Minutes), M10 (10 Minutes).
M12 (12 Minutes), M15 (15 Minutes), M20 (20 Minutes), M30 (30 Minutes) -
Hours:
H1 (1 Hour), H2 (2 Hours), H3 (3 Hours), H4 (4 Hours),
H6 (6 Hours), H8 (8 Hours), H12 (12 Hours) -
Days, Weeks, Months:
D1 (1 Day), W1 (1 Week), MN (1 Month)
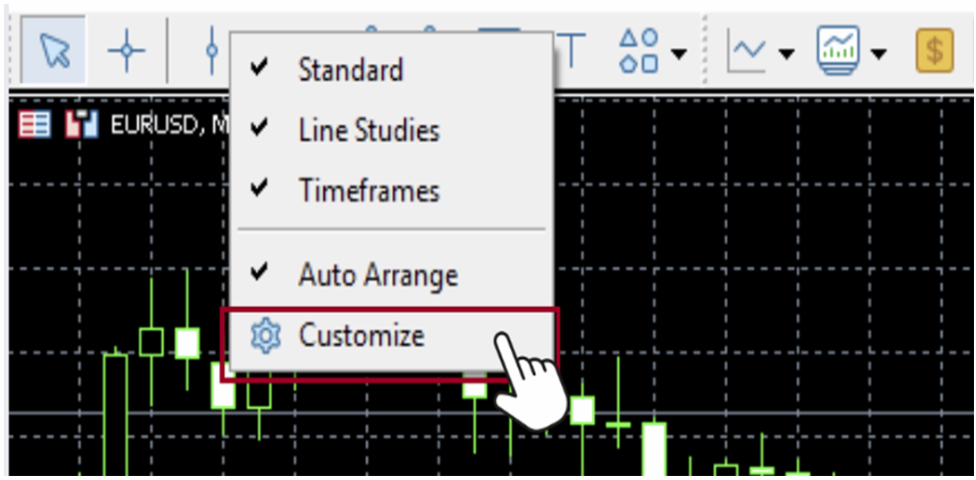
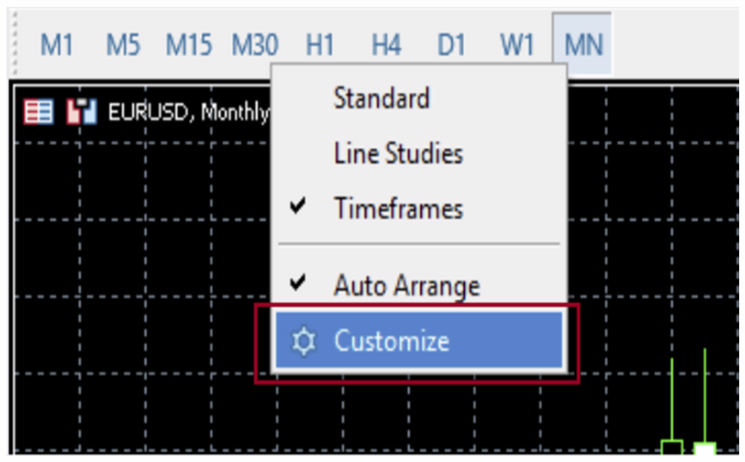
To customize the timeframe toolbar, right-click on the toolbar and select “Customize”. From there, you can add or remove timeframes as needed.
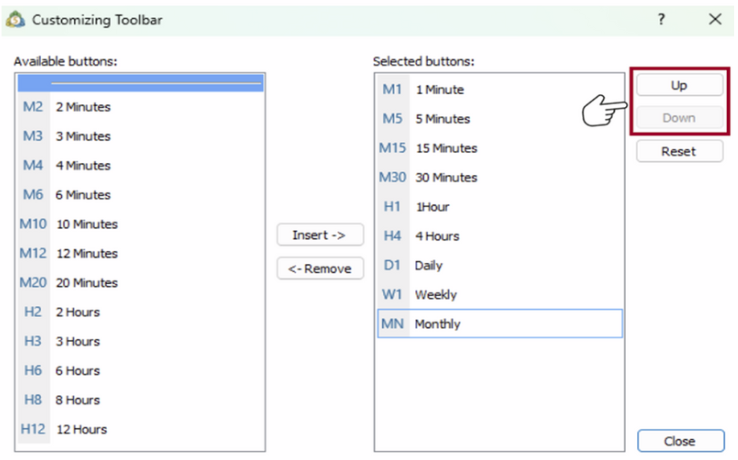
The “Available buttons” on your left side shows buttons not displayed on the timeframe toolbar.
The “Selected buttons” on your right shows buttons that are currently being displayed on the timeframe toolbar.
To insert a new time frame into the Time Frame toolbar, click on the preferred time frame under the “Available buttons” column and then click “Insert->” to insert the preferred Time Frame
into the Time Frame toolbar.

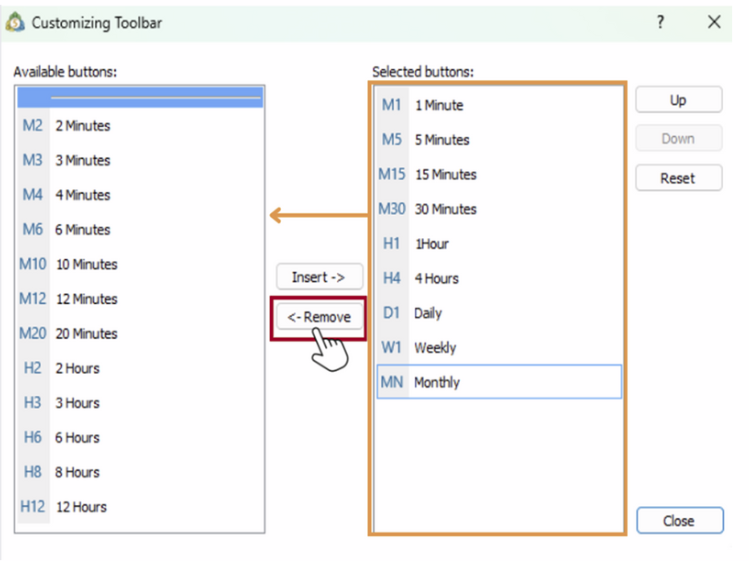
① To add a separating line, select the line in the “Available buttons” and click “Insert ->”.
② To remove a line, select the line in the “Selected buttons” and click “<- Remove".
Note: A separating line is a line that appears next to the timeframe buttons on the toolbar. Place it between the minutes and hours or other positions you prefer to organize timeframe buttons.
Click “Reset”.
Select a timeframe you wish to move in the “Selected buttons” and click “Up” or “Down” to change the location.