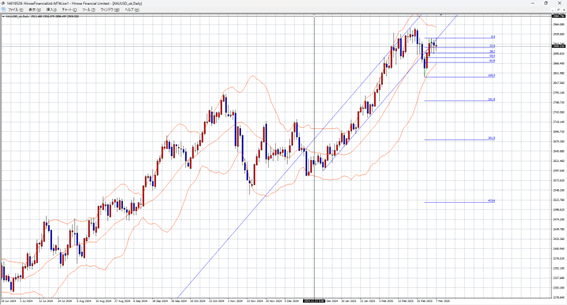
After reaching a new all-time high on February 20, profit-taking caused the price to drop to 2833. Last week, the price started rising again, but for four days, it struggled to go above 2930.
Looking at the daily candlestick chart, three consecutive candles show almost the same opening and closing prices. This suggests that the price is having difficulty moving higher in the short term. It is likely that many traders are selling near 2930 to take profits.
This week, as buying slows down, the price may start falling again. If the price drops below 2890 (a 38.2% Fibonacci retracement level), it could fall further to around 2870 (a 61.8% Fibonacci retracement level). Just below 2870, there is also the lower band of the Bollinger Bands, which could act as strong support. This may be a good place to consider buying.
Expected gold price range this week: 2930 – 2870
Note: The above analysis does not guarantee profit. Please make your own decisions when trading.
