How to Change Timeframes & Styles on MT5 Platform (Android Version)
Part 1 – How to Change Timeframes
Step 1 – Open the MT5 App
– Tap the MetaTrader 5 icon to open the app on your Android device.
Step 1 – Open the MT5 App
– Tap the MetaTrader 5 icon to open the app on your Android device.

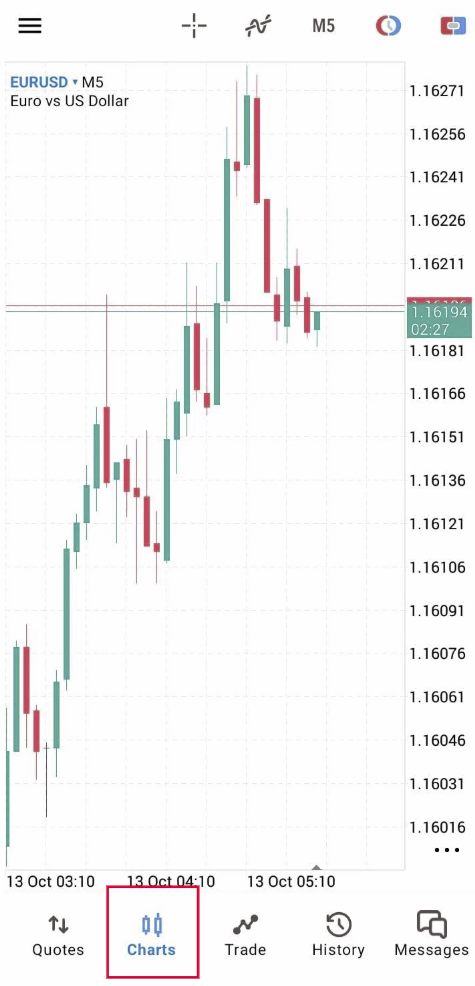
Step 2 – Go to the Chart Screen
– Tap “Charts” at the bottom menu.
– The live chart of the selected instrument (e.g., XAU/USD, EUR/USD) will appear.
– Tap “Charts” at the bottom menu.
– The live chart of the selected instrument (e.g., XAU/USD, EUR/USD) will appear.
Step 3 – Tap the Timeframe Icon
– At the top of the chart, tap the Timeframes button with “M5”.
(You can also directly on the chart.)
– At the top of the chart, tap the Timeframes button with “M5”.
(You can also directly on the chart.)
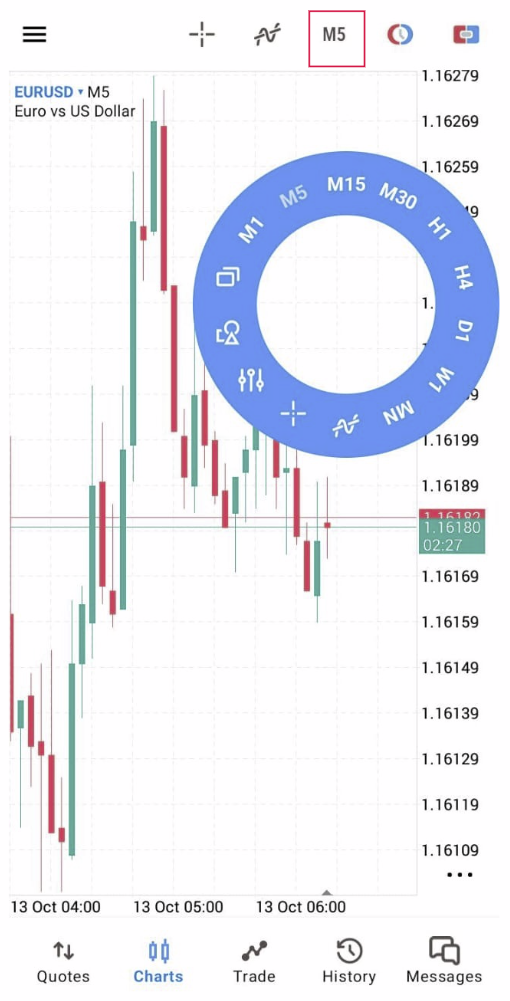
Step 4 – Choose Your Preferred Timeframe
Select the timeframe you want:
Select the timeframe you want:
- – M1 = 1 minute
- – M5 = 5 minutes
- – M15 = 15 minutes
- – M30 = 30 minutes
- – H1 = 1 hour
- – H4 = 4 hours
- – D1 = 1 day
- – W1 = 1 week
- – MN = 1 month
✅ The chart will automatically update to your selected timeframe.
Part 2 – How to Change Chart Styles
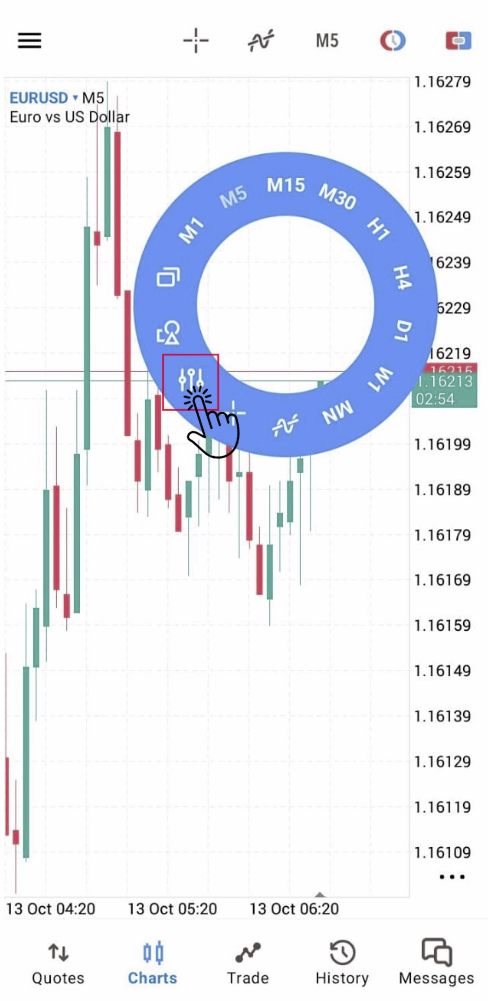
Step 1 – Open Chart Settings
– While on the Chart screen, tap the “Settings” (⚙️) icon.
(Alternatively, tap and hold on the chart, then choose “Settings.”)
Step 1 – Open Chart Settings
– While on the Chart screen, tap the “Settings” (⚙️) icon.
(Alternatively, tap and hold on the chart, then choose “Settings.”)
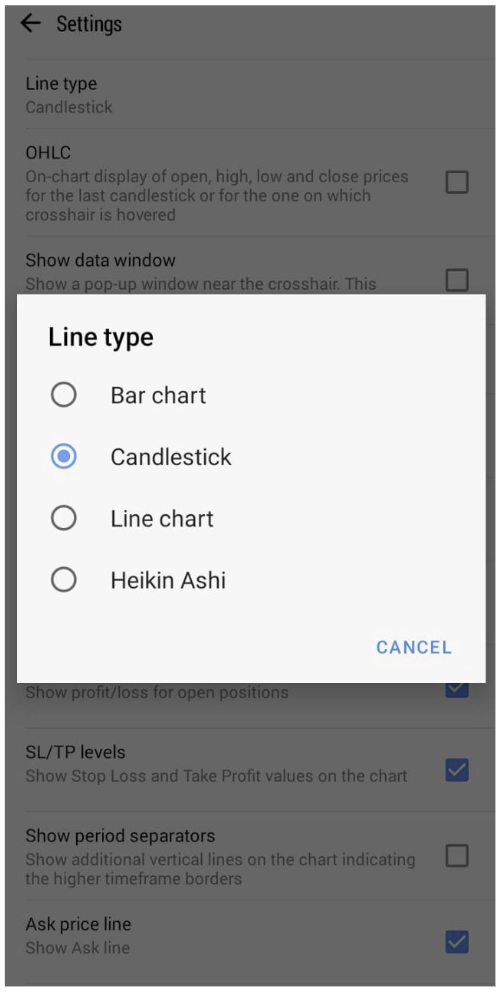
Step 2 – Select Chart Type
Under “Chart Type”, choose your preferred style:
Under “Chart Type”, choose your preferred style:
- – Bar Chart
- – Candlestick Chart
- – Line Chart
- – Heikin Ashi
✅ The chart will immediately switch to the selected style.
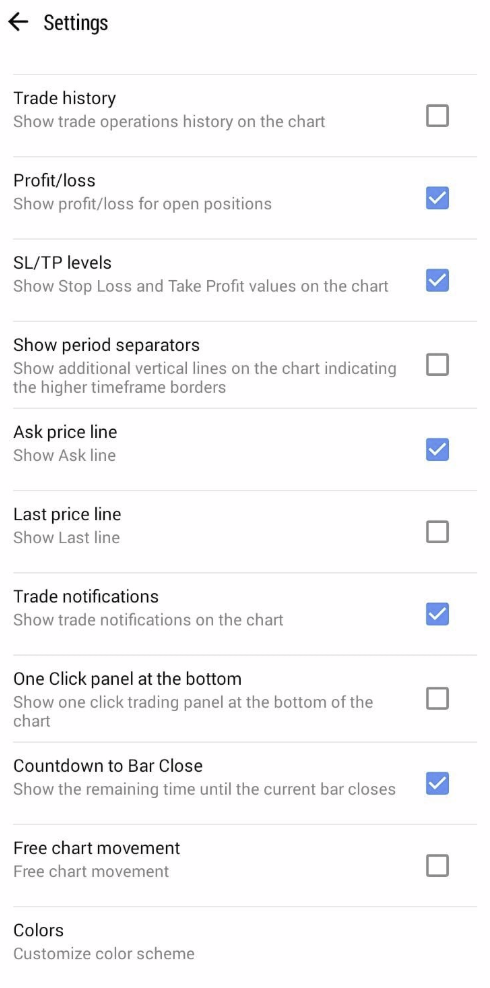
Step 3 – Customize Chart Appearance (Optional)
You can also adjust:
You can also adjust:
- – Colors (background, grid, candles, etc.)
- – Show OHLC, Trade Levels, and Volumes
Go to Settings → Charts → Colors/Options to personalize your chart view.
Step 4 – Save and View Changes
- – Tap Back to return to the chart.
- – Your selected timeframe and chart style will now be displayed.