HIROSE MT4 Original Indicators
Enhance Your Trading Experience!
Get Our Exclusive Original MT4 Indicators Today and Take Your Strategy to the Next Level
Support Your Comfortable MT4 Trading with HIROSE Original Indicators!
We offer original trading tools to help you make the most of MT4.
This will enhance the efficiency and accuracy of your trading.
Advantages of Dashboard Trading
Dashboard trading is a powerful tool that allows you to quickly grasp multiple markets and currency pairs, while monitoring the situation in real-time. By using dashboard tools like “TrendFinder,” you can gain the following benefits:
1.Quick Decision Making
The dashboard consolidates essential information for trading and presents it visually in an easy-to-understand manner.
This allows traders to quickly assess the market situation and make rapid decisions.
2.Simultaneous Monitoring of Multiple Charts
With “TrendFinder,” you can monitor multiple currency pairs and markets at once, enabling you to compare different timeframes and correlated markets while trading. This reduces the risk of mistakes and allows for a more strategic approach.
3.Real-Time Data Analysis
The market is constantly changing, but dashboard tools update data in real-time, allowing you to base your trades on the latest information. This helps you avoid delays or incorrect judgments, making it easier to enter and exit trades at the right moments.
4.Intuitive Operation and Visual Organization
Even complex information is displayed simply, making it intuitive to operate, suitable for traders of all levels, from beginners to advanced. This reduces the time needed to familiarize yourself with the tool, letting you focus more on your trading.
5.Efficient Multitasking
You can manage multiple indicators and information sources on a single screen, making it easier to monitor multiple trades and markets at the same time. This enables you to capture trading opportunities efficiently in a short period.
Indicator Giveaway Application Form
Recommended Minimum Specifications
If your system meets the following specifications, you can use MT4/MT5 for regular trading without any issues:
OS: Windows 10 / 11 (64-bit)
CPU: Quad-core 3GHz or higher
RAM: 8GB or higher
Recommended Specifications for Using Multiple Indicators, MT4 Instances, and Other Applications Simultaneously
For a smoother experience, we recommend the following specifications:
OS: Windows 11 (64-bit)
CPU: 12th Gen Core i5 or higher
RAM: 16GB or higher
With these specifications, you can seamlessly run not only MT4/MT5 but also other applications like browsers and Excel
simultaneously. Additionally, performance will be enhanced when using complex custom indicators.
Indicator Introduction
Dashboard Tools
HRS_TrendFinder.ex4
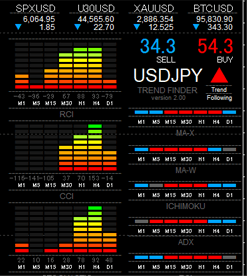
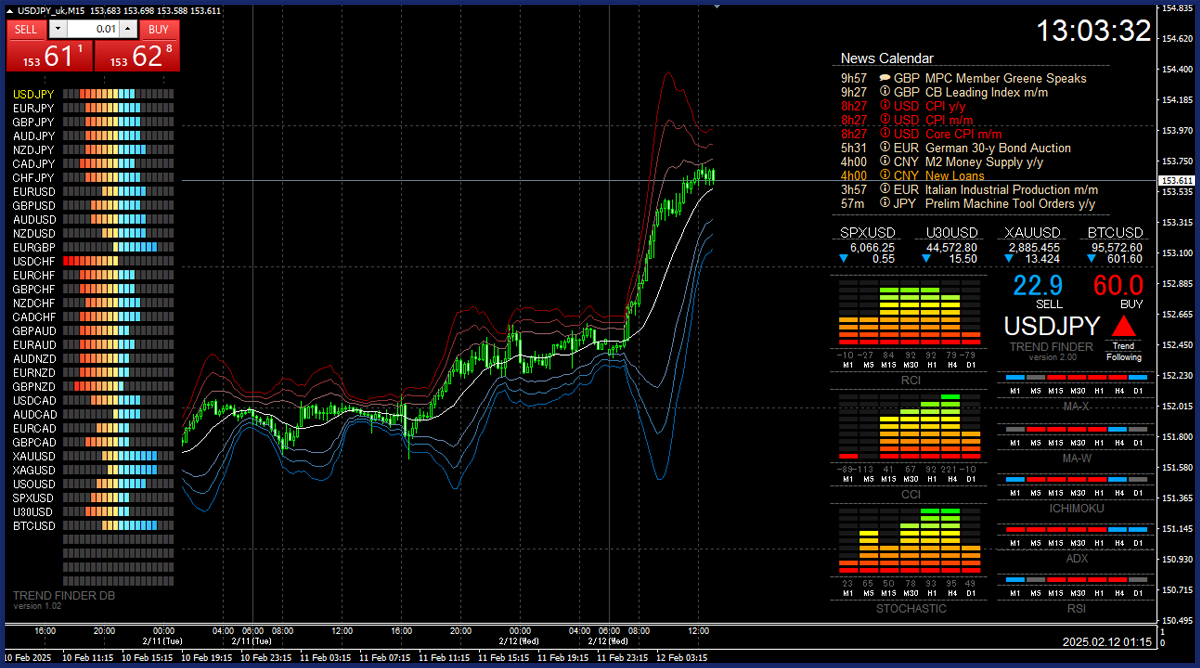
TrendFinder uses a combination of popular indicators such as MA (Moving Average), ICHIMOKU, ADX, and RSI to analyze trends and ranges across multiple timeframes. When a trend is detected on the current timeframe, the direction is shown with a triangle mark for easy identification. Additionally, RCI, CCI, and Stochastic indicators are used to visually assess overbought and oversold conditions, with bar meters indicating these levels to help traders make more informed decisions.
HRS_TrendFinder_Dash.ex4
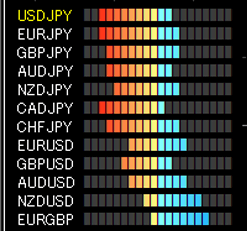
TrendFinder_Dash displays the strength of trends calculated by TrendFinder across various currency pairs. Typically, a trend is considered strong if the strength is above 60%, and anything below that is regarded as a range-bound market.
Additionally, this tool can be used to assess currency strength. For example, if the bar meter is skewed to the left, the baseCurrency is strong, and if it’s skewed to the right, the quoteCurrency is strong. By simply looking at the indicator, you can instantly identify which currency is stronger.
HRS_NewsCalendar.ex4
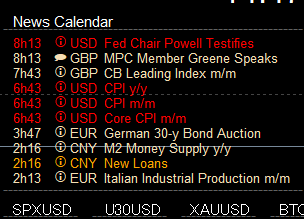
NewsCalendar displays the countdown to upcoming economic data releases, helping you keep track of when important economic indicators will be announced. This tool makes it easier to stay informed about market reactions to scheduled economic events in real-time. Economic indicators shown in red are considered high-impact, and their release can cause significant market volatility. As a result, it’s important to be cautious around these events, as the market can experience sharp movements before and after the announcement. Traders should manage risks effectively and be prepared for unexpected price fluctuations. By accurately tracking the timing of these releases, you can make more strategic trading decisions.
HRS_Grid_Date.ex4
Grid_Date is an indicator that converts the server time grid displayed on MT4 into the user’s local time, making it easier to compare server time with local time for more accurate time-based trading decisions. Additionally, a new feature has been added where, when you hover your cursor over a candlestick on the chart, the local time will be displayed.
HRS_Grid_Price.ex4
Grid_Price is an indicator that draws price lines on the chart at specified pip intervals. Since the price grid on the chart typically fluctuates in width, using this indicator allows you to efficiently monitor the movement of prices within a specific, quantifiable range. This helps traders track fluctuations within a set price range, allowing for more strategic decision-making when determining entry and exit points. It is especially useful for identifying price movements within certain ranges or gauging the strength of trends.
Trend Tools
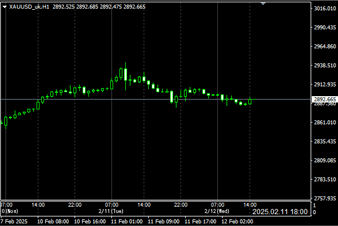
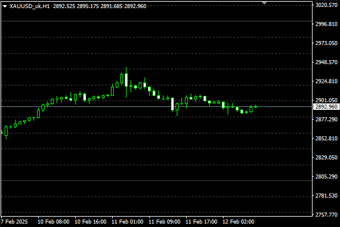
HRS_Heikinashi.ex4
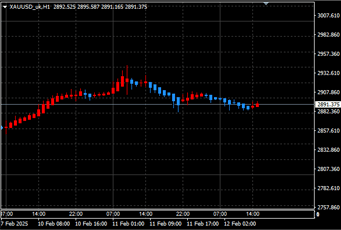
Heikin-Ashi is a technical analysis tool based on traditional candlesticks, designed to make it easier to visualize the strength and direction of trends. Unlike standard candlesticks, Heikin-Ashi candles use an averaged calculation of past data, which reduces noise and provides a clearer view of the underlying trend. This helps smooth out price fluctuations and gives traders valuable insight into whether a trend is continuing or reversing.
HRS_BolingerBands.ex4
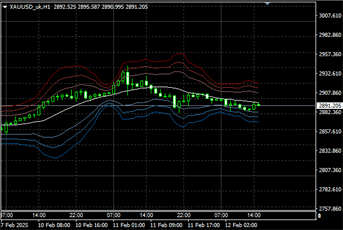
Bollinger Bands is a technical analysis tool used to measure market volatility and visually represent the range within which price movements are occurring. It consists of a moving average (the central line) and two bands placed above and below it (the upper and lower bands). These bands are calculated based on the standard deviation of price, so when price volatility is high, the bands expand, and when price movement is stable, the bands contract.
HRS_Pivot(MTF).ex4
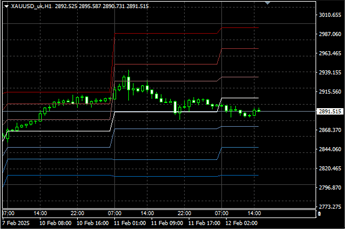
Pivot Points are a technical analysis tool primarily used by day traders, calculated based on the high, low, and closing prices of a specified period. These levels act as key support and resistance points in the market, helping traders identify entry and exit points.
Pivot points consist of a central “pivot price” (the calculated reference point) with multiple support and resistance levels above and below it. This allows traders to visually assess the likelihood of price reversals or breakouts when the price reaches these levels. Particularly, price reactions at pivot levels serve as signals of market momentum and are often used to forecast trend formation or reversals.
Oscillator Tools
HRS_RCI.ex4
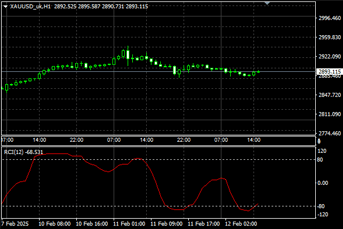
RCI (Rank Correlation Index) is an oscillator-type indicator used to analyze market direction and strength. RCI compares past price data with current price data to quantitatively evaluate market trends. The RCI value fluctuates between -100 and +100, with 0 as the center, moving upward or downward.
Generally, when the RCI is above +80, the market is considered overbought (excessively rising), while below -80 indicates an oversold condition (excessively falling). When the RCI approaches +100 or -100, it signifies a strong trend, with a high correlation to past data.
HRS_ROC.ex4
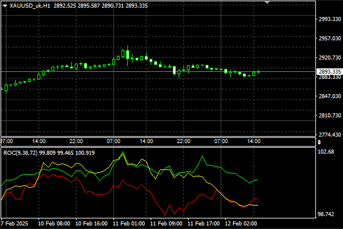
ROC (Rate of Change) is an oscillator-type indicator used to measure price changes over a specific period, helping to assess market momentum and trend strength. ROC compares the current price to the price from a past period and expresses the rate of change as a percentage. The value of this indicator is shown as positive or negative, where positive values indicate an uptrend and negative values indicate a downtrend.
Generally, when the ROC is above 0, it suggests strong upward momentum, while below 0 indicates strong downward momentum. Sharp changes in the ROC or extreme values (high or low) are often used as signals for trend reversals or overbought/oversold conditions.
HRS_RVI.ex4
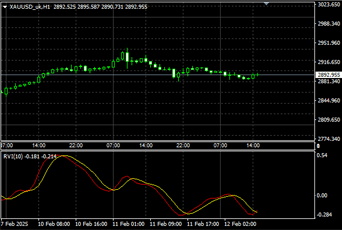
RVI (Relative Vigor Index) is an oscillator-type indicator used to measure market momentum and strength by comparing the closing price to the opening price. The RVI focuses on visualizing the energy behind price movements, particularly the strength of upward or downward price movements.
The RVI typically has a baseline of 0, with positive values indicating upward momentum and negative values indicating downward momentum. Similar to moving averages, the RVI provides a smooth and visually understandable chart, helping traders identify trend reversals.
Indicator Giveaway Application Form
Recommended Minimum Specifications
If your system meets the following specifications, you can use MT4/MT5 for regular trading without any issues:
OS: Windows 10 / 11 (64-bit)
CPU: Quad-core 3GHz or higher
RAM: 8GB or higher
Recommended Specifications for Using Multiple Indicators, MT4 Instances, and Other Applications
Simultaneously
For a smoother experience, we recommend the following specifications:
OS: Windows 11 (64-bit)
CPU: 12th Gen Core i5 or higher
RAM: 16GB or higher
With these specifications, you can seamlessly run not only MT4/MT5 but also other applications like browsers
and Excel
simultaneously. Additionally, performance will be enhanced when using complex custom indicators.