HIROSE MT4 Original Indicators
Enhance Your Trading Experience!
Get Our Exclusive Original MT4 Indicators Today and Take Your Strategy to the Next Level
HRS_TrendFinder.ex4
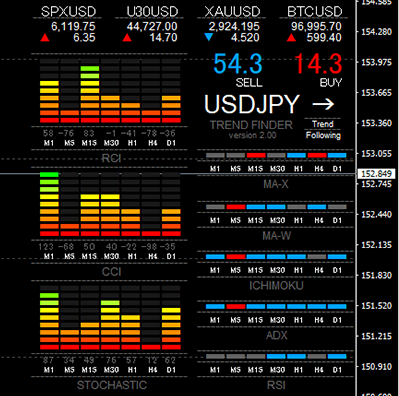
TrendFinder uses a combination of popular indicators such as MA (Moving Average), ICHIMOKU, ADX, and RSI to analyze trends and ranges across multiple timeframes. When a trend is detected on the current timeframe, the direction is shown with a triangle mark for easy identification. Additionally, RCI, CCI, and Stochastic indicators are used to visually assess overbought and oversold conditions, with bar meters indicating these levels to help traders make more informed decisions.
1. Version Information
2025.02.01 Version 2.00 Released
2025.02.02 Version 2.01 Bug Fixes
2025.02.14 Version 2.02 Bug Fixes
2. How to Set Up
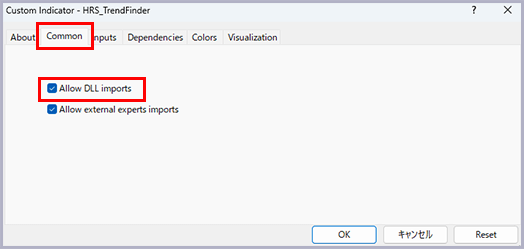
This indicator uses a DLL, so please make sure to check the option to allow DLL imports.
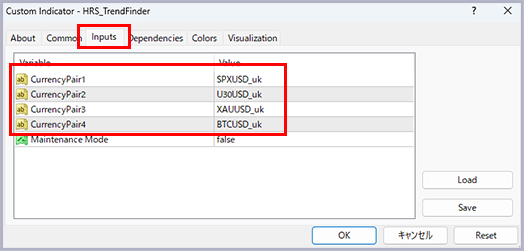
The input settings are only for changing the assets of interest at the top of the indicator.
The settings for the various gauges in this indicator are fixed for ease of use. Parameter changes for each technical tool are not possible.
3. How to Use
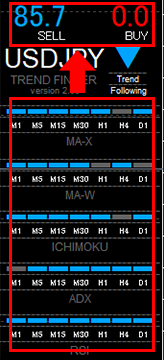
MA-X uses the cross of two moving averages, a short-term and a medium-term moving average, to determine whether the market is trending or ranging.
MA-W uses the relationship between candlestick prices and a long-term moving average to assess the trend direction.
ICHIMOKU determines the trend based on the position of the candlesticks relative to the Ichimoku cloud. If the candlestick is above the cloud, it signals a buy trend, and if it’s below the cloud, it signals a sell trend.
ADX assesses the trend by looking at the cross of +DI and -DI, along with the value of the ADX indicator being above a certain threshold.
RSI identifies the trend when the RSI line exceeds the predefined range.
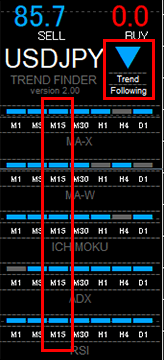
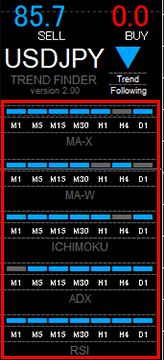
For example, on the 15-minute chart of USDJPY, various technical analysis tools are used to comprehensively assess the market conditions. This involves analyzing the results of the MA-X, MA-W, ICHIMOKU, ADX, and RSI indicators to clearly determine whether the current market is a “trending market” or a “ranging market.” This information is then displayed visually for easy understanding. The final assessment result is shown in the “Trend Following” section at the top-right of the image, in the form of an arrow. This arrow helps traders quickly grasp the market’s direction.
The numbers displayed at the top of the image represent the ratio of buy and sell signals across all timeframes and all technical analysis indicators. These numbers help in understanding the overall market sentiment and reflect the degree of alignment among technical indicators across various time frames. For example, as shown in the image, if the buy ratio is 0%, it indicates that a strong selling trend is currently occurring in the market. The information provided by this ratio is valuable for traders, as it allows them to quickly grasp the market’s direction and make informed trading decisions.
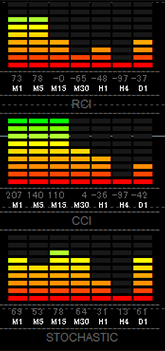
In RCI, CCI, and STOCHASTIC, bar meters are set up to visually display overbought and oversold conditions indicated by each indicator. This allows traders to quickly assess the status of indicators across all timeframes at a glance. This feature is particularly useful for determining the timing of exits. For example, if the bar meter is extremely skewed to the upper or lower end, it signals excessive buying or selling, which can be a valuable signal for considering position closure.