Forex Academy:
Primary School
5 minutes
Lesson 4
Is it possible to predict prices
using candlestick charts?
- What is a candlestick chart?
- Is it possible to predict prices using candlestick charts?
- Special candlestick patterns predict the possibility of a market reversal
”What do candlestick charts represent in Forex trading?”
”What can you learn from candlestick charts?”
”Why can you predict prices using candlestick charts?”
These are common questions asked by new Forex traders.
Candlestick charts are an important indicator that reflect the price movements of many investment products, not just Forex.
This lesson will explain the definition and mechanics of candlestick charts in Forex trading.
Make sure to go through the entire lesson to learn how to use candlestick charts!
What is a candlestick chart?

Candlestick charts represent the price movements of investment products such as Forex, and they were invented in Japan.
The advantage of candlestick charts is that you can quickly grasp past price data, market movements, and understand price trends.
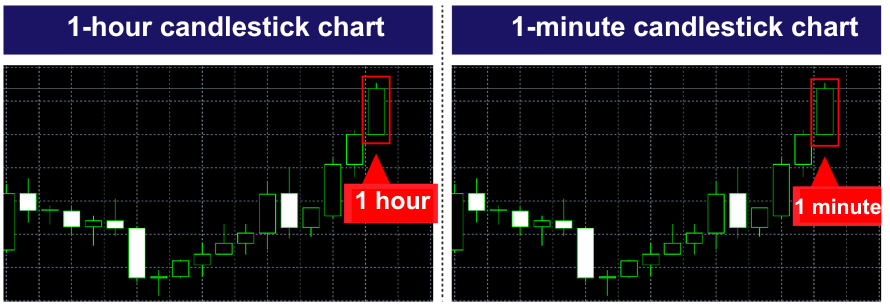
Each candlestick in a Forex chart represents the price movement over a specific time period, but you can change the timeframe displayed.
(1-minute (M1), 5-minutes (M5), 15-minutes (M15), 30-minutes (M30), 1-hour (H1), 4-hours (H4), daily (D1), weekly (W1), monthly (MN)).
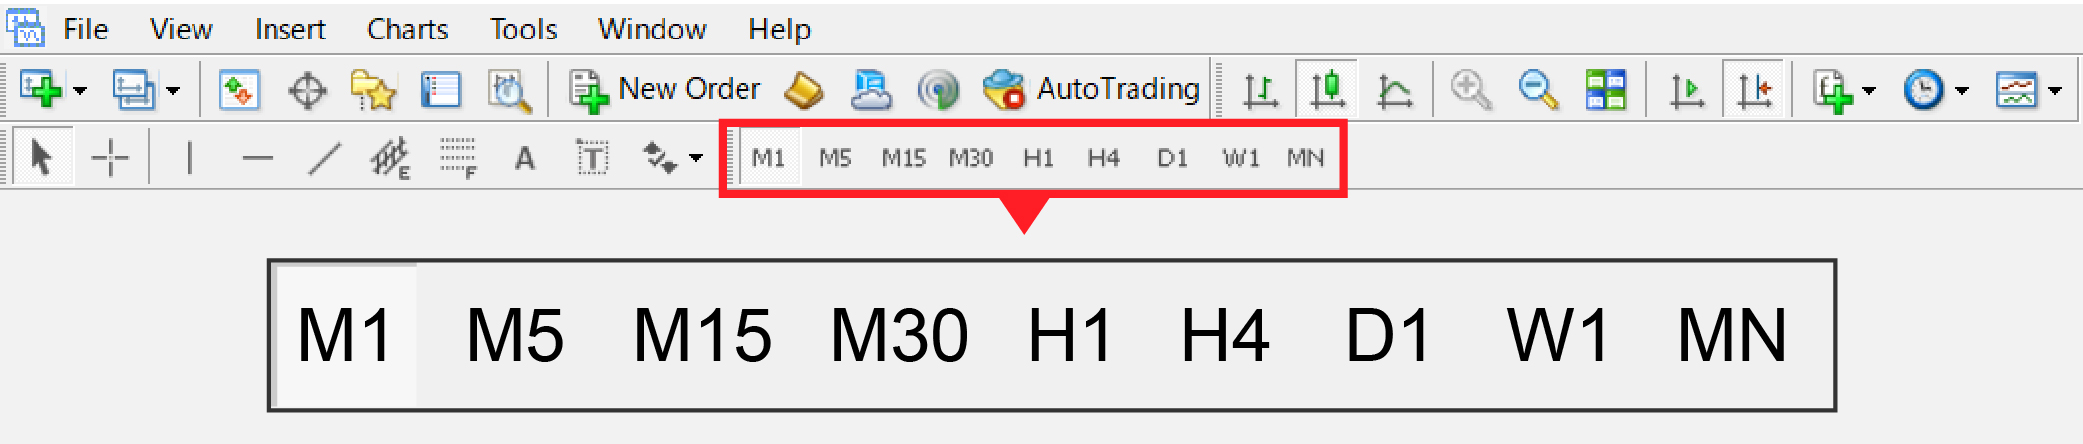
For example, if you select a 1-hour (H1) timeframe, each candlestick will represent the price movement of the currency pair over a 1-hour period.
If you select a 1-minute (M1) timeframe, each candlestick will represent the price movement of the currency pair over a 1-minute period.
Is it possible to predict prices using candlestick charts?
If you look at the candlestick chart on the Metatrader 4 trading platform from Hirose,
you can identify whether the price is rising or falling. The candlestick chart will have 2 colors:
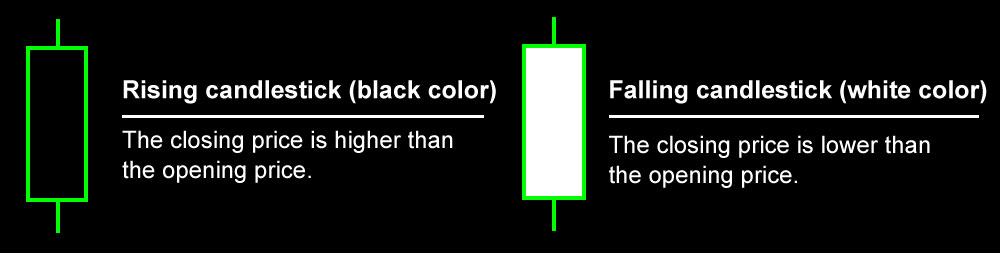
Note: For the desktop and iPhone versions, the black candlestick represents a rising candlestick, and the white candlestick represents a falling candlestick. For the Android version, it is the opposite – the white candlestick represents a rising candlestick, and the black candlestick represents a falling candlestick.
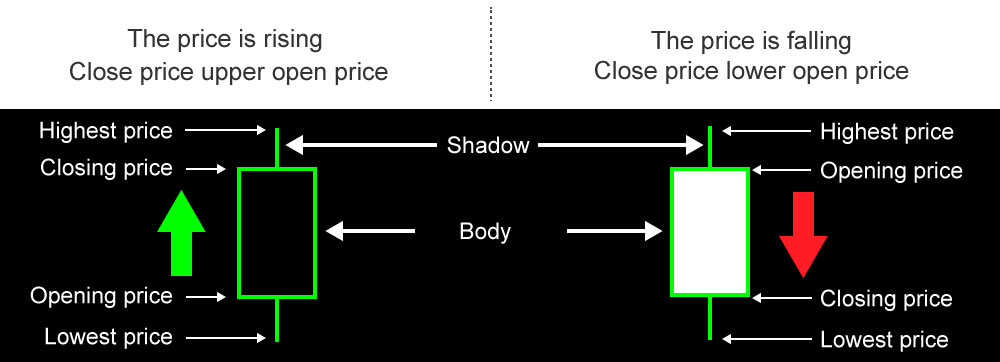
For example, in the case of a 1-minute candlestick:
Opening price: the price at the beginning of the 1-minute period
Closing price: the price at the end of the 1-minute period
Highest price: the highest price during the 1-minute period
Lowest price: the lowest price during the 1-minute period
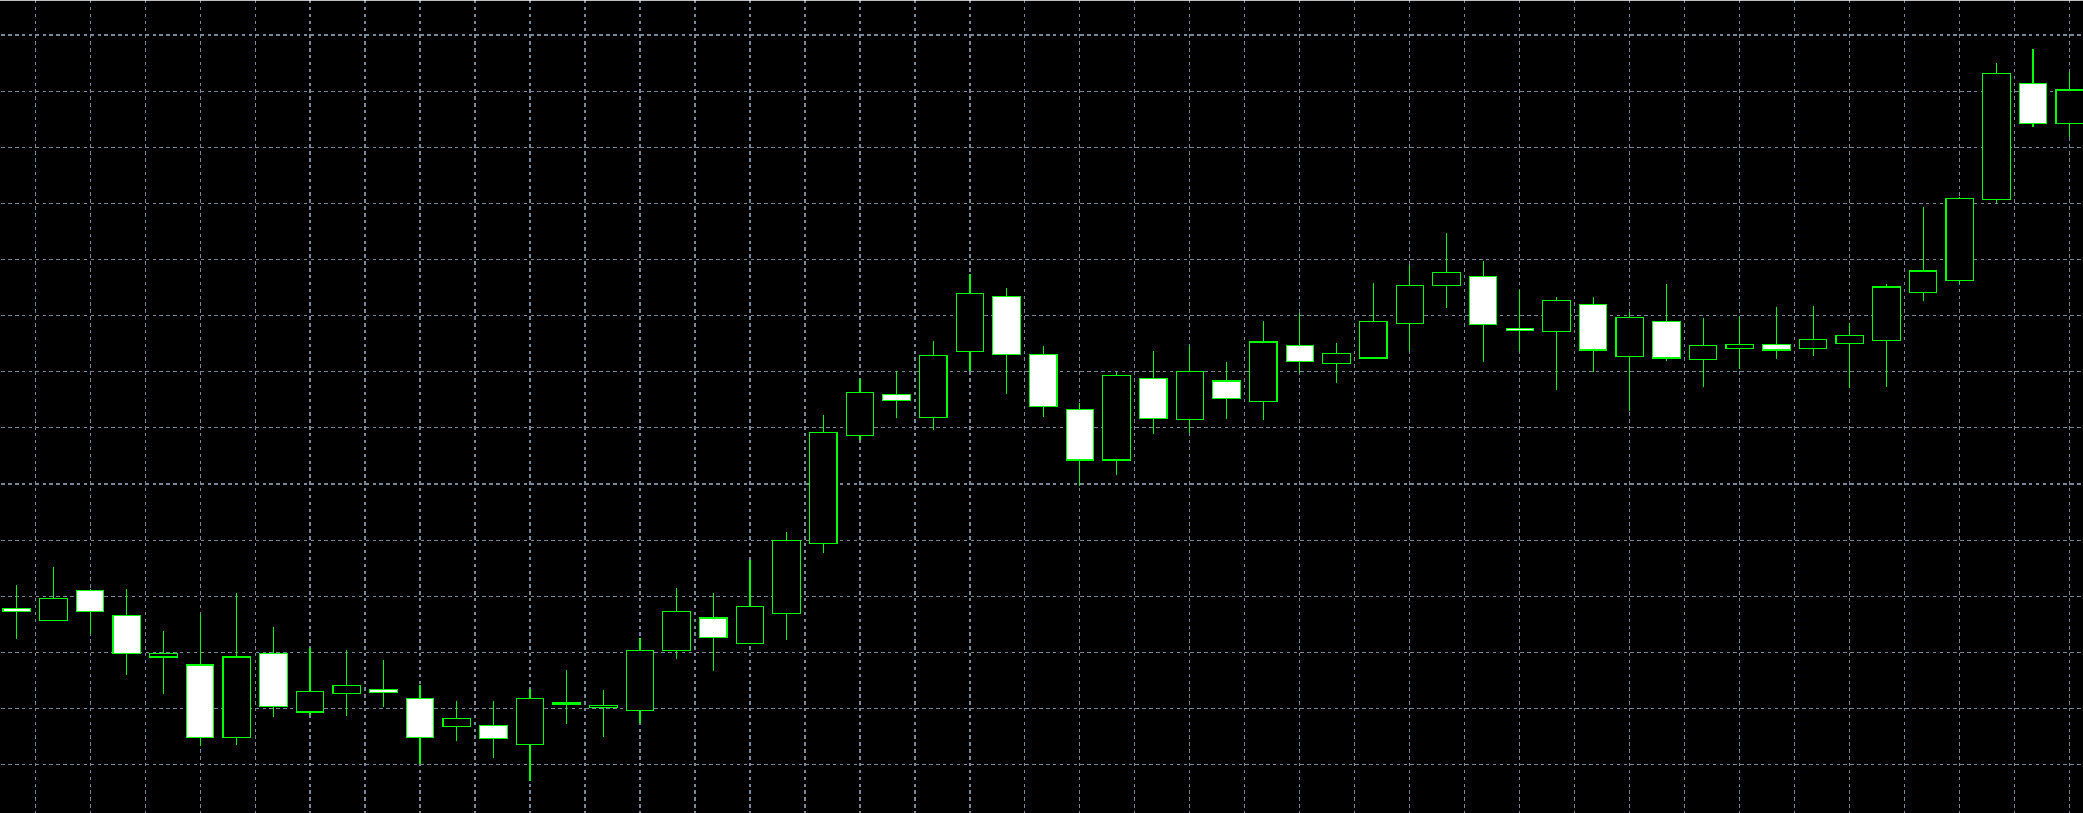
You can identify the price movement trend by observing the arrangement of the candlesticks.
* Uptrend
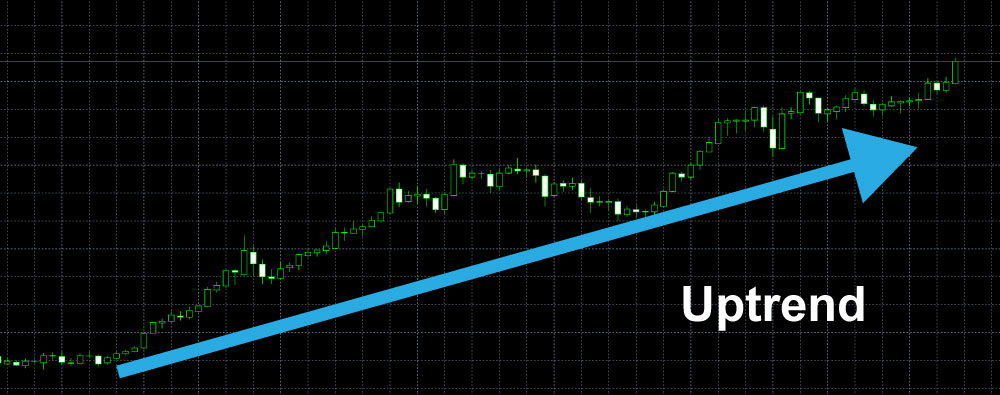
In an uptrend, the position of the candlesticks will continue to rise over a certain period of time compared to the previous period.
In the image above, you can also notice that the black candlesticks appear consecutively next to each other.
* Downtrend
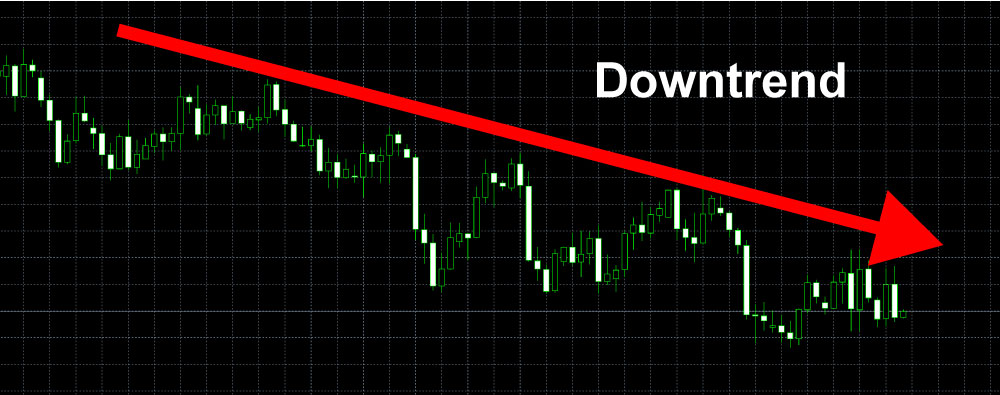
Looking at the image, you can see that the positions of the candlestick are continuing to decline compared to the previous period.
You can also observe that consecutive white candlestick bodies are appearing side by side.
* Sideway (Horizontal Trend)
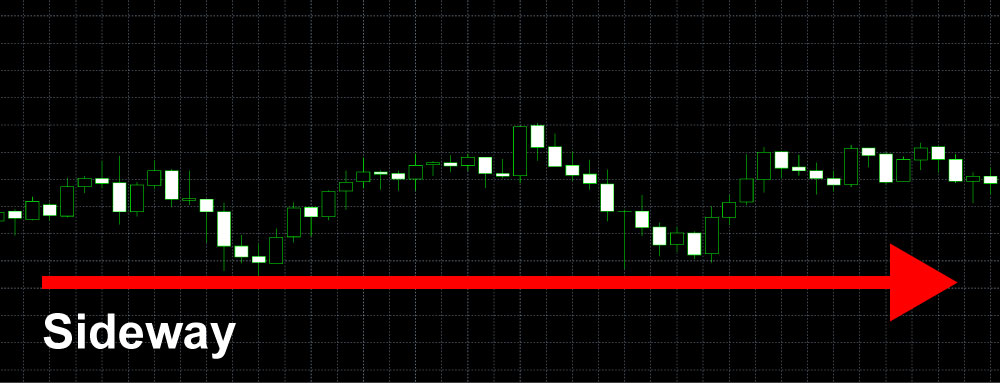
If the Forex chart is continuously moving up and down within a certain range, it is called a “Sideways/Horizontal Trend”.
Since it is very difficult to determine whether the price trend is rising or falling in a sideway market, if you are a beginner, it is best to wait and see how situation change.
However, the market will not continue to move sideway for a long time, and the price may then rise or fall sharply and move in a certain direction.
You should temporarily wait and check the chart regularly.
Special candlestick patterns predict the possibility of a market reversal
In Forex, candlesticks often have a shape consisting of a large body and 2 shadows at both ends.
However, please note that sometimes special shapes may appear and will affect the market price.
Next, I will introduce you to some special candlestick patterns that have the potential to cause the market to reverse.
· Does the doji candlestick cause the market price trend to change?
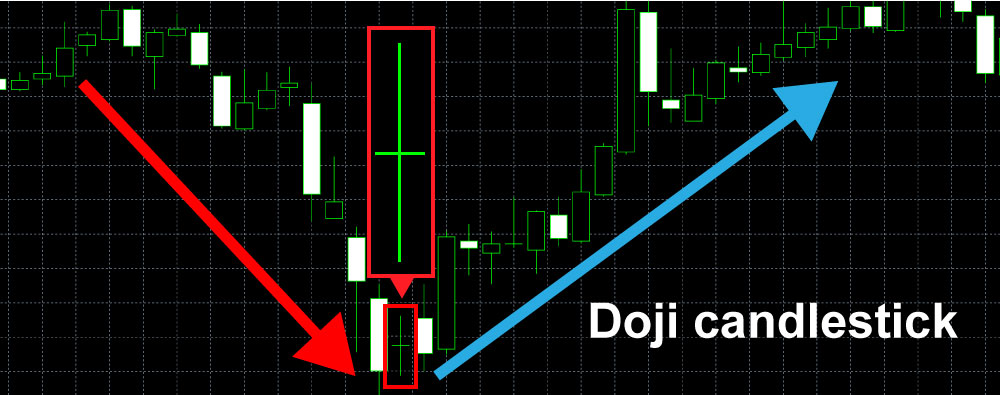
The Doji candlestick has a shape resembling as a cross.
The body is very narrow and the upper shadow and lower shadow are very long.
In Forex trading, the Doji candlestick is a sign that there is a conflict between the buys and the sells.If the price has been rising or falling continuously and you see a Doji candlestick appear,the price trend is very likely to reverse.
If you see a Doji candlestick, you can predict that the price will reverse and try to place an order.
• Be careful when the shadows are too short or not visible at all.
If you cannot see the shadows at all, please check.
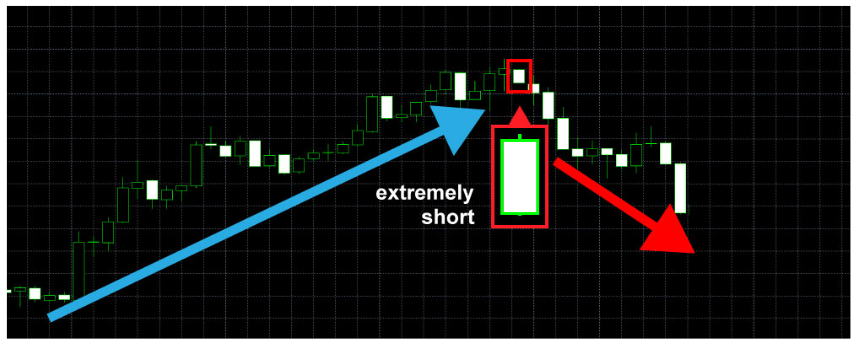
If the price has been rising, but a falling candlestick appears with no shadow (or extremely short shadow), this can be considered a potential sign of the beginning of a downtrend.
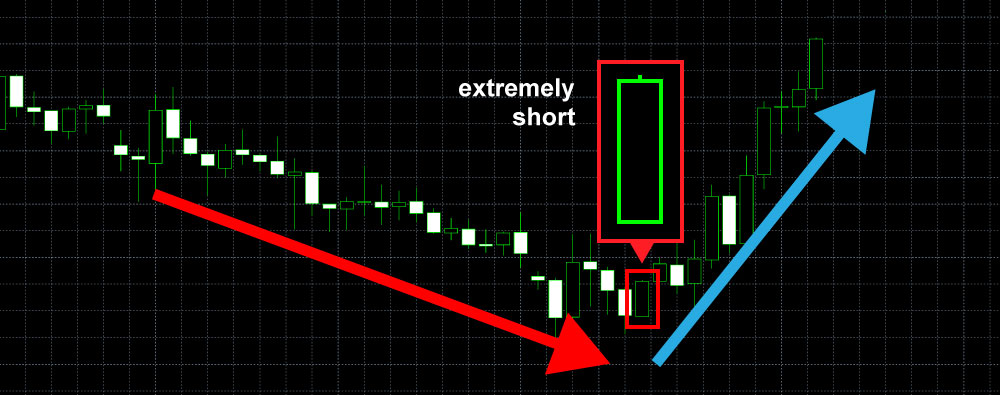
However, if the price has been falling but a rising candlestick appears with no shadow (or extremely short shadow), this can be considered a potential sign of the beginning of an uptrend.
Candlestick charts are considered such a fundamental and important part of knowledge that they can be said to form the foundation of Forex trading.
If you can master the knowledge of candlestick charts, you will be able to identify the right times to buy and sell,
thereby significantly increasing your chances of profiting.
The lesson on “Is it possible to predict prices using candlestick charts?” finish here.
Let’s check if you’ve understood the lesson!

In the next lesson, we will guide you through currency pairs. Please continue to follow
If you have any questions, please feel free to contact us.